
Edmonton Oilers at New York Rangers
· National Hockey League

Arvidsson scores go-ahead goal as Oilers beat Rangers 3-1

Corey Perry and Connor McDavid also scored for Edmonton, which won its second-straight to complete a four-game trip. The Oilers were coming off a 2-1 overtime win over the Islanders on Friday. Ryan Nugent-Hopkins had three assists and Stuart Skinner finished with 21 saves.
Will Cuylle scored for the Rangers, and Igor Shesterkin had 20 saves. New York snapped a two-game win streak.
Arvidsson beat Shesterkin with high shot at 6:09 of the third for his ninth goal of the season to put Edmonton up 2-1.
McDavid made it a two-goal lead with his 25th with 3:25 remaining.
Perry scored a power-play goal off a goalmouth scramble with 43 seconds left in the first to give Edmonton a 1-0 lead. It was the 39-year-old's 15th of the season and 444th of his career.
Cuylle tied it with his 18th at the 5-minute mark of the second.
Oilers: Edmonton improved to 19-13-2 on the road.
EDM wins series 2-0
Scoring Summary
 |
Goal | 1st Period 19:17 | Corey Perry Goal (15) Backhand, assists: Ryan Nugent-Hopkins (24), Leon Draisaitl (52) |
 |
Goal | 2nd Period 5:00 | Will Cuylle Goal (18) Wrist Shot, assists: Artemi Panarin (43), Vincent Trocheck (26) |
|
Goal | 3rd Period 6:09 | Viktor Arvidsson Goal (9) Deflected, assists: Ryan Nugent-Hopkins (25) |
|
Goal | 3rd Period 16:35 | Connor McDavid Goal (25) Snap Shot, assists: Ryan Nugent-Hopkins (26), Brett Kulak (16) |
Statistics
 EDM EDM |
 NYR NYR |
|
|---|---|---|
| 19 | Blocked Shots | 16 |
| 17 | Hits | 18 |
| 5 | Takeaways | 5 |
| 23 | Shots | 22 |
| 1 | Power Play Goals | 0 |
| 4 | Power Play Opportunities | 3 |
| 25.0 | Power Play Percentage | 0.0 |
| 0 | Short Handed Goals | 0 |
| 0 | Shootout Goals | 0 |
| 24 | Faceoffs Won | 23 |
| 51.1 | Faceoff Win Percent | 48.9 |
| 17 | Giveaways | 15 |
| 3 | Total Penalties | 4 |
| 6 | Penalty Minutes | 8 |
 New York Rangers Injuries
| NAME, POS | STATUS | DATE |
|---|---|---|
| Carson Soucy, D | Out | Apr 17 |
| Braden Schneider, D | Out | Apr 13 |
| Arthur Kaliyev, RW | Out | Mar 18 |
| Adam Edstrom, C | Injured Reserve | Feb 4 |
 Edmonton Oilers Injuries
| NAME, POS | STATUS | DATE |
|---|---|---|
| Trent Frederic, C | Day-To-Day | Apr 19 |
| Evander Kane, LW | Injured Reserve | Apr 19 |
| Troy Stecher, D | Out | Apr 19 |
| John Klingberg, D | Injured Reserve | Apr 19 |
| Mattias Ekholm, D | Out | Apr 14 |
Game Information
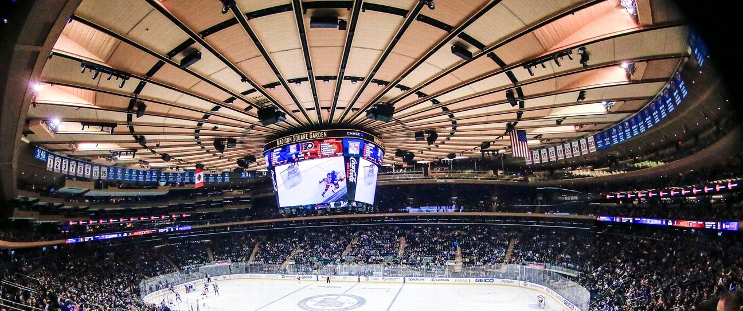 Madison Square Garden
Location: New York, NY
Attendance: 18,006 | Capacity:
Location: New York, NY
Attendance: 18,006 | Capacity:
2024-25 Pacific Division Standings
| TEAM | W | L | PTS | OTL |
|---|---|---|---|---|
 Vegas Vegas |
50 | 22 | 110 | 10 |
 Los Angeles Los Angeles |
48 | 25 | 105 | 9 |
 Edmonton Edmonton |
48 | 29 | 101 | 5 |
 Calgary Calgary |
41 | 27 | 96 | 14 |
 Vancouver Vancouver |
38 | 30 | 90 | 14 |
 Anaheim Anaheim |
35 | 37 | 80 | 10 |
 Seattle Seattle |
35 | 41 | 76 | 6 |
 San Jose San Jose |
20 | 50 | 52 | 12 |
2024-25 Metropolitan Division Standings
| TEAM | W | L | PTS | OTL |
|---|---|---|---|---|
 Washington Washington |
51 | 22 | 111 | 9 |
 Carolina Carolina |
47 | 30 | 99 | 5 |
 New Jersey New Jersey |
42 | 33 | 91 | 7 |
 Columbus Columbus |
40 | 33 | 89 | 9 |
 NY Rangers NY Rangers |
39 | 36 | 85 | 7 |
 NY Islanders NY Islanders |
35 | 35 | 82 | 12 |
 Pittsburgh Pittsburgh |
34 | 36 | 80 | 12 |
 Philadelphia Philadelphia |
33 | 39 | 76 | 10 |