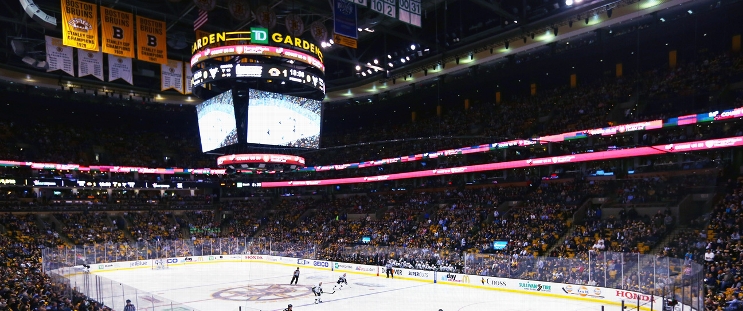
Edmonton Oilers at Boston Bruins
· National Hockey LeagueAdam Henrique scores 2, Connor McDavid has power-play goal as Oilers blank Bruins 4-0

Stuart Skinner, who left the game late in the first period after a collision with the Bruins' Nikita Zadorov before returning at the start of the second, stopped 26 shots as the Oilers won for the 12th time in their last 15 games.
Viktor Arvidsson added an empty-netter for Edmonton, while center Leon Draisaitl’s point streak was halted at 14 games.
It was the Bruins’ fifth straight loss, their worst stretch since interim coach Joe Sacco took over for the fired Jim Montgomery on Nov. 19.
Henrique’s first goal made it 1-0 when he beat Jeremy Swayman with a wrist shot from the slot 6:33 into the game.
McDavid’s 16th made it 2-0 at 11:11 of the second.
Swayman made 35 saves but lost his fourth straight start.
Referee Chris Rooney, a Boston native, worked his 1,500th career game.
Bruins: It was their second straight home loss after a six-game home win streak.
This story has been corrected. A previous version contained an incorrect reference to McDavid extending a points streak.
Regular Season SeriesEDM wins series 2-0
Scoring Summary
 |
Goal | 1st Period 6:33 | Adam Henrique Goal (4) Wrist Shot, assists: Corey Perry (7), Brett Kulak (8) |
 |
Goal | 2nd Period 11:11 | Connor McDavid Goal (16) Snap Shot, assists: Ryan Nugent-Hopkins (13) |
 |
Goal | 2nd Period 16:35 | Adam Henrique Goal (5) Snap Shot, assists: Jeff Skinner (8), Zach Hyman (10) |
 |
Goal | 3rd Period 16:25 | Viktor Arvidsson Goal (5) Wrist Shot, assists: Brett Kulak (9) |
Statistics
 EDM EDM |
 BOS BOS |
|
|---|---|---|
| 16 | Blocked Shots | 17 |
| 18 | Hits | 45 |
| 13 | Takeaways | 11 |
| 39 | Shots | 26 |
| 1 | Power Play Goals | 0 |
| 3 | Power Play Opportunities | 2 |
| 33.3 | Power Play Percentage | 0.0 |
| 0 | Short Handed Goals | 0 |
| 0 | Shootout Goals | 0 |
| 27 | Faceoffs Won | 20 |
| 57.4 | Faceoff Win Percent | 42.6 |
| 12 | Giveaways | 11 |
| 3 | Total Penalties | 4 |
| 9 | Penalty Minutes | 11 |
Game Information
 TD Garden
Location: Boston, MA
Attendance: 17,850 | Capacity:

Location: Boston, MA
Attendance: 17,850 | Capacity:
2024-25 Pacific Division Standings
| TEAM | W | L | PTS | OTL |
|---|---|---|---|---|
 Vegas Vegas |
28 | 9 | 59 | 3 |
 Edmonton Edmonton |
25 | 12 | 53 | 3 |
 Los Angeles Los Angeles |
23 | 10 | 51 | 5 |
 Vancouver Vancouver |
18 | 12 | 46 | 10 |
 Calgary Calgary |
19 | 14 | 45 | 7 |
 Anaheim Anaheim |
17 | 18 | 39 | 5 |
 Seattle Seattle |
17 | 21 | 37 | 3 |
 San Jose San Jose |
13 | 24 | 32 | 6 |
2024-25 Atlantic Division Standings
| TEAM | W | L | PTS | OTL |
|---|---|---|---|---|
 Toronto Toronto |
27 | 13 | 56 | 2 |
 Florida Florida |
24 | 15 | 50 | 2 |
 Boston Boston |
20 | 18 | 45 | 5 |
 Tampa Bay Tampa Bay |
21 | 15 | 44 | 2 |
 Ottawa Ottawa |
19 | 17 | 41 | 3 |
 Montreal Montreal |
19 | 18 | 41 | 3 |
 Detroit Detroit |
18 | 18 | 40 | 4 |
 Buffalo Buffalo |
15 | 21 | 35 | 5 |

