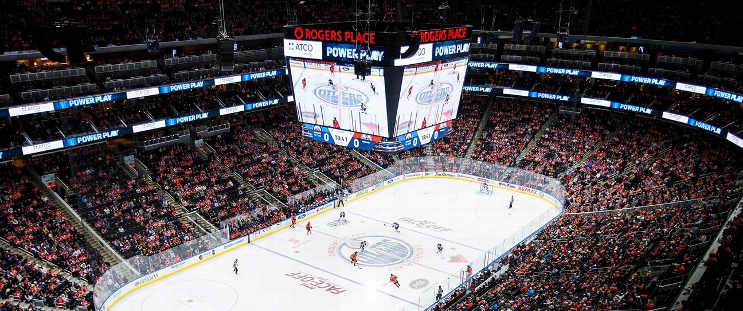
Boston Bruins at Edmonton Oilers
· National Hockey LeagueMcDavid ties it late and Ekholm gives Oilers a 3-2 win over Bruins in OT

Just 1:04 into the extra period, Bruins goalie Jeremy Swayman made the initial save on Leon Draisaitl but Ryan Nugent-Hopkins was there to grab the rebound and drop it back to Ekholm, who scored his fourth goal of the season.
Draisaitl had three assists to give him 900 career points.
Zach Hyman had a goal and an assist for the Oilers (19-11-2), who have won nine of 11.
Elias Lindholm and Mark Kastelic scored in the first period to give Boston (17-13-4) a 2-0 lead.
Stuart Skinner made 24 saves for the Oilers. Swayman stopped 23 shots.
Oilers: Hyman has eight goals in seven games since returning from injury. He wore a full face shield after sustaining a broken nose when he took a slap shot to the face Monday against Florida.
Oilers: Host the San Jose Sharks on Saturday.
Regular Season SeriesEDM leads series 1-0
Scoring Summary
 |
Goal | 1st Period 1:07 | Elias Lindholm Goal (5) Snap Shot, assists: Brad Marchand (13), Charlie McAvoy (9) |
 |
Goal | 1st Period 17:35 | Mark Kastelic Goal (4) Backhand, assists: John Beecher (6), Brandon Carlo (3) |
 |
Goal | 2nd Period 11:17 | Zach Hyman Goal (11) Snap Shot, assists: Leon Draisaitl (25) |
 |
Goal | 3rd Period 17:39 | Connor McDavid Goal (15) Poke, assists: Zach Hyman (6), Leon Draisaitl (26) |
 |
Goal | 4th Period 1:04 | Mattias Ekholm Goal (4) Snap Shot, assists: Ryan Nugent-Hopkins (12), Leon Draisaitl (27) |
Statistics
 BOS BOS |
 EDM EDM |
|
|---|---|---|
| 14 | Blocked Shots | 10 |
| 30 | Hits | 25 |
| 5 | Takeaways | 8 |
| 26 | Shots | 26 |
| 0 | Power Play Goals | 0 |
| 2 | Power Play Opportunities | 2 |
| 0.0 | Power Play Percentage | 0.0 |
| 0 | Short Handed Goals | 0 |
| 0 | Shootout Goals | 0 |
| 30 | Faceoffs Won | 26 |
| 53.6 | Faceoff Win Percent | 46.4 |
| 13 | Giveaways | 25 |
| 2 | Total Penalties | 2 |
| 4 | Penalty Minutes | 4 |
Game Information
 Rogers Place
Location: Edmonton, AB
Attendance: 18,347 | Capacity:

Location: Edmonton, AB
Attendance: 18,347 | Capacity:
2024-25 Atlantic Division Standings
| TEAM | W | L | PTS | OTL |
|---|---|---|---|---|
 Florida Florida |
34 | 20 | 71 | 3 |
 Toronto Toronto |
33 | 20 | 68 | 2 |
 Tampa Bay Tampa Bay |
31 | 20 | 66 | 4 |
 Ottawa Ottawa |
29 | 23 | 62 | 4 |
 Detroit Detroit |
28 | 22 | 61 | 5 |
 Boston Boston |
27 | 24 | 60 | 6 |
 Montreal Montreal |
25 | 26 | 55 | 5 |
 Buffalo Buffalo |
22 | 27 | 49 | 5 |
2024-25 Pacific Division Standings
| TEAM | W | L | PTS | OTL |
|---|---|---|---|---|
 Edmonton Edmonton |
34 | 17 | 72 | 4 |
 Vegas Vegas |
33 | 17 | 72 | 6 |
 Los Angeles Los Angeles |
29 | 17 | 65 | 7 |
 Vancouver Vancouver |
26 | 18 | 63 | 11 |
 Calgary Calgary |
26 | 21 | 60 | 8 |
 Anaheim Anaheim |
24 | 24 | 54 | 6 |
 Seattle Seattle |
24 | 29 | 52 | 4 |
 San Jose San Jose |
15 | 35 | 37 | 7 |

