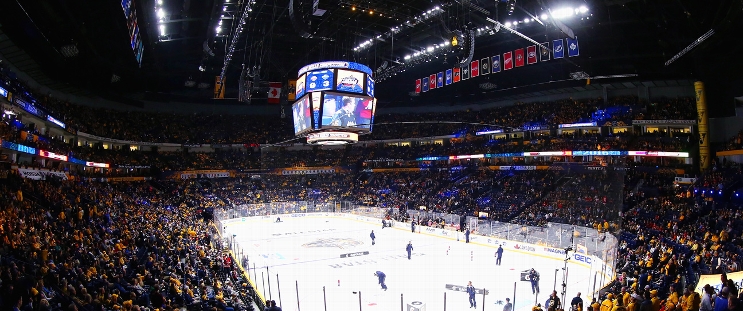
Edmonton Oilers at Nashville Predators
· National Hockey LeagueDraisaitl scores twice, assists another to lead Oilers to 5-1 win over Predators

Viktor Arvidsson, Corey Perry and Zach Hyman also scored, and Calvin Pickard made 26 saves for the Oilers, who have won three of their last four. Edmonton played its first game since losing team captain Connor McDavid to an ankle injury in the first period of Monday night’s 6-1 loss to the Blue Jackets.
Filip Forsberg scored, and Juuse Saros made 24 saves for the Predators.
Playing in his first career NHL game, Edmonton’s Noah Philp picked up the secondary assist on Perry’s first-period goal for his first NHL point.
Predators: Nashville was 3-0-1 in its last four games prior to Thursday night’s dreadful performance. If the Predators hope to climb out of their early-season hole, they need to find consistent scoring aside from Forsberg, who leads the team with five goals.
EDM leads series 2-0
Scoring Summary
 |
Goal | 1st Period 0:37 | Viktor Arvidsson Goal (1) Backhand, assists: Leon Draisaitl (5), Vasily Podkolzin (2) |
 |
Goal | 1st Period 5:05 | Filip Forsberg Goal (5) Wrist Shot, assists: none |
 |
Goal | 1st Period 9:54 | Corey Perry Goal (2) Backhand, assists: Drake Caggiula (1), Noah Philp (1) |
 |
Goal | 2nd Period 9:03 | Leon Draisaitl Goal (7) Wrist Shot, assists: none |
 |
Goal | 3rd Period 1:48 | Leon Draisaitl Goal (8) Wrist Shot, assists: Mattias Ekholm (7), Evan Bouchard (4) |
 |
Goal | 3rd Period 12:46 | Zach Hyman Goal (1) Wrist Shot, assists: Darnell Nurse (4), Jeff Skinner (3) |
Statistics
 EDM EDM |
 NSH NSH |
|
|---|---|---|
| 19 | Blocked Shots | 11 |
| 20 | Hits | 30 |
| 7 | Takeaways | 5 |
| 29 | Shots | 27 |
| 0 | Power Play Goals | 1 |
| 1 | Power Play Opportunities | 3 |
| 0.0 | Power Play Percentage | 33.3 |
| 0 | Short Handed Goals | 0 |
| 0 | Shootout Goals | 0 |
| 27 | Faceoffs Won | 23 |
| 54.0 | Faceoff Win Percent | 46.0 |
| 10 | Giveaways | 9 |
| 5 | Total Penalties | 3 |
| 16 | Penalty Minutes | 12 |
Game Information
 Bridgestone Arena
Location: Nashville, TN
Attendance: 17,159 | Capacity:

Location: Nashville, TN
Attendance: 17,159 | Capacity:
2024-25 Pacific Division Standings
| TEAM | W | L | PTS | OTL |
|---|---|---|---|---|
 Vegas Vegas |
29 | 14 | 62 | 4 |
 Edmonton Edmonton |
29 | 15 | 61 | 3 |
 Los Angeles Los Angeles |
25 | 14 | 55 | 5 |
 Calgary Calgary |
22 | 16 | 51 | 7 |
 Vancouver Vancouver |
20 | 16 | 50 | 10 |
 Seattle Seattle |
21 | 24 | 45 | 3 |
 Anaheim Anaheim |
18 | 23 | 42 | 6 |
 San Jose San Jose |
14 | 30 | 34 | 6 |
2024-25 Central Division Standings
| TEAM | W | L | PTS | OTL |
|---|---|---|---|---|
 Winnipeg Winnipeg |
31 | 14 | 65 | 3 |
 Minnesota Minnesota |
28 | 15 | 60 | 4 |
 Dallas Dallas |
29 | 17 | 59 | 1 |
 Colorado Colorado |
28 | 19 | 57 | 1 |
 St. Louis St. Louis |
23 | 21 | 50 | 4 |
 Utah Utah |
20 | 19 | 47 | 7 |
 Nashville Nashville |
17 | 22 | 41 | 7 |
 Chicago Chicago |
15 | 28 | 34 | 4 |

