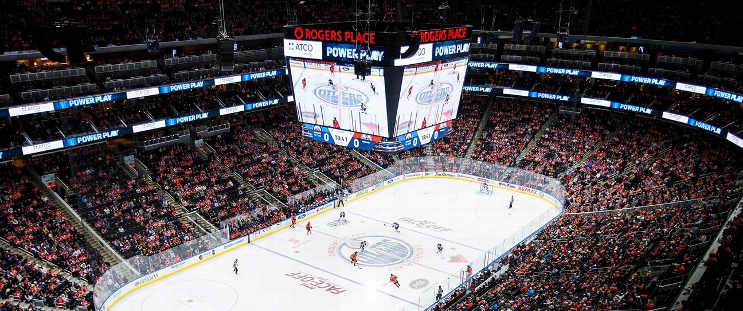
Philadelphia Flyers at Edmonton Oilers
· National Hockey LeagueDraisaitl scores 56 seconds into OT to give Oilers 4-3 win over Flyers

Connor McDavid, who had two assists, had a breakaway in the overtime, but was stopped by Flyers goalie Samuel Ersson. But he picked up the rebound and send it in front to Draisaitl, who scored his second of the season.
Adam Henrique, Connor Brown and Evan Bouchard also scored for the Oilers, who snapped a three-game losing skid to start the season during which they were outscored 15-3.
Matvei Michkov scored his first two NHL goals in just his third career game and Bobby Brink also scored for the Flyers.
Stuart Skinner had 27 saves for Edmonton, and Ersson made 29 stops.
Oilers: McDavid extended his point streak against the Flyers to 11 games, the longest active run in the NHL. McDavid came into the game with 11 goals and 31 points in 14 games against Philadelphia, or 2.31 points per game.
Oilers: Visit the Nashville Predators on Thursday night.
Regular Season SeriesEDM leads series 1-0
Scoring Summary
 |
Goal | 1st Period 4:46 | Matvei Michkov Goal (1) Backhand, assists: Owen Tippett (1), Morgan Frost (2) |
 |
Goal | 1st Period 9:21 | Matvei Michkov Goal (2) Snap Shot, assists: Morgan Frost (3), Travis Konecny (1) |
 |
Goal | 2nd Period 6:26 | Adam Henrique Goal (1) Backhand, assists: Mattias Janmark (1), Brett Kulak (1) |
 |
Goal | 2nd Period 14:01 | Connor Brown Goal (1) Snap Shot, assists: Jeff Skinner (2), Darnell Nurse (1) |
 |
Goal | 2nd Period 19:37 | Bobby Brink Goal (1) Wrist Shot, assists: Egor Zamula (1), Joel Farabee (2) |
 |
Goal | 3rd Period 16:18 | Evan Bouchard Goal (1) Wrist Shot, assists: Connor McDavid (3), Leon Draisaitl (1) |
 |
Goal | 4th Period 0:56 | Leon Draisaitl Goal (2) Snap Shot, assists: Connor McDavid (4) |
Statistics
 PHI PHI |
 EDM EDM |
|
|---|---|---|
| 21 | Blocked Shots | 9 |
| 21 | Hits | 23 |
| 7 | Takeaways | 7 |
| 30 | Shots | 31 |
| 2 | Power Play Goals | 0 |
| 7 | Power Play Opportunities | 4 |
| 28.6 | Power Play Percentage | 0.0 |
| 0 | Short Handed Goals | 0 |
| 0 | Shootout Goals | 0 |
| 27 | Faceoffs Won | 39 |
| 40.9 | Faceoff Win Percent | 59.1 |
| 9 | Giveaways | 12 |
| 6 | Total Penalties | 9 |
| 18 | Penalty Minutes | 24 |
Game Information
 Rogers Place
Location: Edmonton, AB
Attendance: 18,347 | Capacity:

Location: Edmonton, AB
Attendance: 18,347 | Capacity:
2024-25 Metropolitan Division Standings
| TEAM | W | L | PTS | OTL |
|---|---|---|---|---|
 New Jersey New Jersey |
11 | 6 | 24 | 2 |
 Carolina Carolina |
11 | 4 | 22 | 0 |
 Washington Washington |
10 | 4 | 21 | 1 |
 NY Rangers NY Rangers |
9 | 4 | 19 | 1 |
 NY Islanders NY Islanders |
6 | 6 | 16 | 4 |
 Pittsburgh Pittsburgh |
6 | 9 | 15 | 3 |
 Philadelphia Philadelphia |
6 | 8 | 14 | 2 |
 Columbus Columbus |
5 | 8 | 12 | 2 |
2024-25 Pacific Division Standings
| TEAM | W | L | PTS | OTL |
|---|---|---|---|---|
 Vegas Vegas |
10 | 4 | 22 | 2 |
 Los Angeles Los Angeles |
9 | 6 | 21 | 3 |
 Vancouver Vancouver |
8 | 3 | 19 | 3 |
 Calgary Calgary |
8 | 6 | 19 | 3 |
 Edmonton Edmonton |
8 | 7 | 17 | 1 |
 Seattle Seattle |
7 | 8 | 15 | 1 |
 San Jose San Jose |
5 | 9 | 13 | 3 |
 Anaheim Anaheim |
5 | 8 | 12 | 2 |

