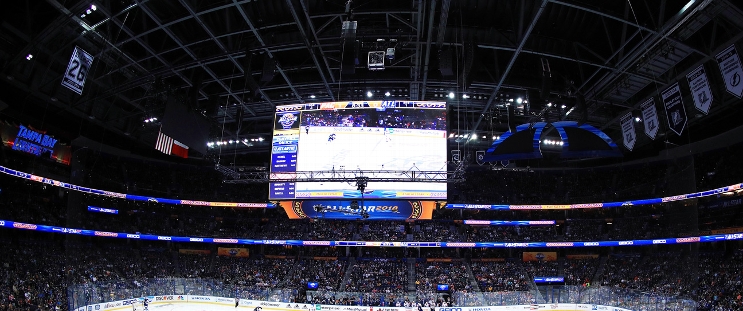
Toronto Maple Leafs at Tampa Bay Lightning
· National Hockey League
Regular Season Series
TOR leads series 3-0
Statistics
 TOR TOR |
 TB TB |
|
|---|---|---|
| 2.88 | Goals Against Average | 2.58 |
| 29.3 | Shots Against per Game | 28.4 |
| 78.2 | Penalty Kill Percentage | 81.6 |
| 48 | Power Play Goals Against | 36 |
| 0 | Short Handed Goals Against | 0 |
| 3.28 | Goals For per Game | 3.56 |
| 28.2 | Shots per Game | 28.6 |
| 53 | Power Play Goals | 56 |
| 26.0 | Power Play Percentage | 25.7 |
| 6 | Short Handed Goals | 10 |
| 600 | Penalty Minutes | 630 |
 Tampa Bay Lightning Injuries
| NAME, POS | STATUS | DATE |
|---|
 Toronto Maple Leafs Injuries
| NAME, POS | STATUS | DATE |
|---|---|---|
| Jake McCabe, D | Out | Apr 7 |
| David Kampf, C | Out | Apr 7 |
| Jani Hakanpaa, D | Injured Reserve | Feb 1 |
Game Information
 Amalie Arena
Location: Tampa, FL
Capacity:

Amalie Arena
Location: Tampa, FL
Capacity:
2024-25 Atlantic Division Standings
| TEAM | W | L | PTS | OTL |
|---|---|---|---|---|
 Toronto Toronto |
47 | 25 | 98 | 4 |
 Tampa Bay Tampa Bay |
45 | 26 | 96 | 6 |
 Florida Florida |
44 | 29 | 92 | 4 |
 Ottawa Ottawa |
42 | 29 | 90 | 6 |
 Montreal Montreal |
38 | 30 | 85 | 9 |
 Detroit Detroit |
36 | 33 | 79 | 7 |
 Buffalo Buffalo |
34 | 36 | 74 | 6 |
 Boston Boston |
31 | 38 | 71 | 9 |


 SJ
SJ LA
LA ANA
ANA CBJ
CBJ NYI
NYI NYR
NYR