
Vegas Golden Knights at Detroit Red Wings
· National Hockey League

Recently acquired Mrazek earns first shutout of season as Red Wings blank Knights 3-0

Mrazek was making his third start since he was acquired from Chicago at the trade deadline.
Rookie defenseman Albert Johansson scored his second career goal at 7:58 of the second period to give Detroit the lead.
Lucas Raymond and Marco Kasper had third-period goals for the Red Wings, who had lost seven of their past eight games.
Ilya Samsonov made 24 saves for the Golden Knights, who have lost four of their past five games.
Red Wings: Their victory provided a little momentum entering a four-game road trip. The Red Wings, who haven't qualified for the postseason the past eight years, play 10 of their last 15 games on the road.
DET leads series 1-0
Scoring Summary
 |
Goal | 2nd Period 7:58 | Albert Johansson Goal (2) Wrist Shot, assists: Vladimir Tarasenko (18), J.T. Compher (19) |
|
Goal | 3rd Period 4:51 | Lucas Raymond Goal (23) Wrist Shot, assists: Elmer Soderblom (6) |
|
Goal | 3rd Period 11:14 | Marco Kasper Goal (13) Tip-In, assists: Erik Gustafsson (16), Patrick Kane (29) |
Statistics
 VGK VGK |
 DET DET |
|
|---|---|---|
| 10 | Blocked Shots | 16 |
| 21 | Hits | 15 |
| 7 | Takeaways | 5 |
| 18 | Shots | 27 |
| 0 | Power Play Goals | 0 |
| 0 | Power Play Opportunities | 2 |
| 0.0 | Power Play Percentage | 0.0 |
| 0 | Short Handed Goals | 0 |
| 0 | Shootout Goals | 0 |
| 27 | Faceoffs Won | 23 |
| 54.0 | Faceoff Win Percent | 46.0 |
| 23 | Giveaways | 15 |
| 3 | Total Penalties | 1 |
| 6 | Penalty Minutes | 2 |
 Detroit Red Wings Injuries
| NAME, POS | STATUS | DATE |
|---|---|---|
| Erik Gustafsson, D | Out | Apr 17 |
 Vegas Golden Knights Injuries
| NAME, POS | STATUS | DATE |
|---|
Game Information
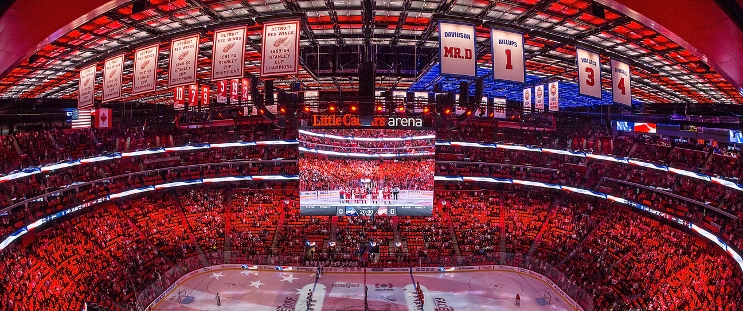 Little Caesars Arena
Location: Detroit, MI
Attendance: 19,515 | Capacity:
Location: Detroit, MI
Attendance: 19,515 | Capacity:
2024-25 Pacific Division Standings
| TEAM | W | L | PTS | OTL |
|---|---|---|---|---|
 Vegas Vegas |
50 | 22 | 110 | 10 |
 Los Angeles Los Angeles |
48 | 25 | 105 | 9 |
 Edmonton Edmonton |
48 | 29 | 101 | 5 |
 Calgary Calgary |
41 | 27 | 96 | 14 |
 Vancouver Vancouver |
38 | 30 | 90 | 14 |
 Anaheim Anaheim |
35 | 37 | 80 | 10 |
 Seattle Seattle |
35 | 41 | 76 | 6 |
 San Jose San Jose |
20 | 50 | 52 | 12 |
2024-25 Atlantic Division Standings
| TEAM | W | L | PTS | OTL |
|---|---|---|---|---|
 Toronto Toronto |
52 | 26 | 108 | 4 |
 Tampa Bay Tampa Bay |
47 | 27 | 102 | 8 |
 Florida Florida |
47 | 31 | 98 | 4 |
 Ottawa Ottawa |
45 | 30 | 97 | 7 |
 Montreal Montreal |
40 | 31 | 91 | 11 |
 Detroit Detroit |
39 | 35 | 86 | 8 |
 Buffalo Buffalo |
36 | 39 | 79 | 7 |
 Boston Boston |
33 | 39 | 76 | 10 |