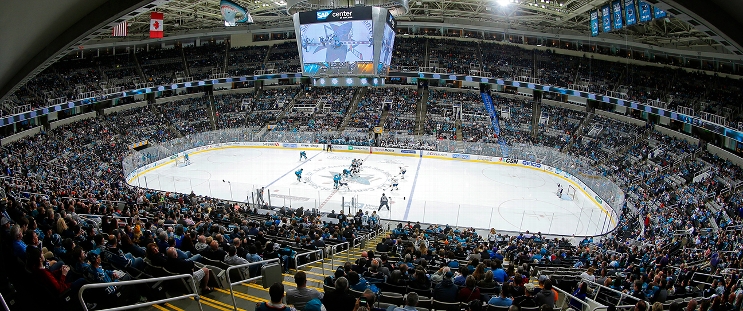
Montreal Canadiens at San Jose Sharks
· National Hockey LeagueArmia scores short-handed tiebreaking goal late in 3rd as Canadiens beat Sharks 4-3

Alex Newhook had a goal and an assist, and Cole Caufield and Brendan Gallagher also scored for the Canadiens, who were 0-4-1 during their skid. Kirby Dach had two assists and Sam Montembault finished with 27 saves.
Macklin Celebrini and Tyler Toffoli each had a goal and an assist, and Collin Graf also scored for the Sharks, who have lost two straight and eight of nine. Alexandar Georgiev had 16 saves.
Armia scored his 10th goal with 4:04 left on a wrist shot off an assist from Jake Evans.
Gallagher gave the Canadiens a 3-2 lead with a power-play goal at 2:40 of the third, and Toffoli's power-play goal tied it with 9:33 remaining.
Sharks: San Jose has lost 11 of 13 and 22 of 26 since Dec. 5.
MTL leads series 1-0
Scoring Summary
 |
Goal | 1st Period 5:52 | Macklin Celebrini Goal (17) Slap Shot, assists: Tyler Toffoli (15), William Eklund (28) |
 |
Goal | 2nd Period 0:52 | Cole Caufield Goal (26) Snap Shot, assists: Nick Suzuki (37), Lane Hutson (37) |
 |
Goal | 2nd Period 4:53 | Alex Newhook Goal (10) Slap Shot, assists: Alexandre Carrier (16), Kirby Dach (10) |
 |
Goal | 2nd Period 14:51 | Collin Graf Goal (1) Wrist Shot, assists: Barclay Goodrow (3) |
 |
Goal | 3rd Period 2:40 | Brendan Gallagher Goal (12) Wrist Shot, assists: Kirby Dach (11), Alex Newhook (6) |
 |
Goal | 3rd Period 10:27 | Tyler Toffoli Goal (19) Backhand, assists: Macklin Celebrini (22), Jake Walman (23) |
 |
Goal | 3rd Period 15:56 | Joel Armia Goal (10) Wrist Shot, assists: Jake Evans (16) |
Statistics
 MTL MTL |
 SJ SJ |
|
|---|---|---|
| 21 | Blocked Shots | 23 |
| 29 | Hits | 17 |
| 5 | Takeaways | 2 |
| 20 | Shots | 30 |
| 2 | Power Play Goals | 2 |
| 4 | Power Play Opportunities | 4 |
| 50.0 | Power Play Percentage | 50.0 |
| 1 | Short Handed Goals | 0 |
| 0 | Shootout Goals | 0 |
| 27 | Faceoffs Won | 19 |
| 58.7 | Faceoff Win Percent | 41.3 |
| 13 | Giveaways | 15 |
| 4 | Total Penalties | 3 |
| 8 | Penalty Minutes | 8 |
 San Jose Sharks Injuries
| NAME, POS | STATUS | DATE |
|---|---|---|
| Yaroslav Askarov, G | Out | Apr 2 |
| Henry Thrun, D | Day-To-Day | Apr 2 |
| Jimmy Schuldt, D | Day-To-Day | Apr 2 |
| Vincent Desharnais, D | Day-To-Day | Apr 2 |
| Shakir Mukhamadullin, D | Day-To-Day | Apr 2 |
 Montreal Canadiens Injuries
| NAME, POS | STATUS | DATE |
|---|---|---|
| Rafael Harvey-Pinard, LW | Out | Mar 19 |
Game Information
 SAP Center at San Jose
Location: San Jose, CA
Attendance: 11,215 | Capacity:

Location: San Jose, CA
Attendance: 11,215 | Capacity:
2024-25 Atlantic Division Standings
| TEAM | W | L | PTS | OTL |
|---|---|---|---|---|
 Toronto Toronto |
46 | 25 | 96 | 4 |
 Tampa Bay Tampa Bay |
44 | 25 | 93 | 5 |
 Florida Florida |
44 | 27 | 92 | 4 |
 Ottawa Ottawa |
39 | 29 | 84 | 6 |
 Montreal Montreal |
35 | 30 | 79 | 9 |
 Detroit Detroit |
34 | 33 | 75 | 7 |
 Buffalo Buffalo |
32 | 36 | 70 | 6 |
 Boston Boston |
30 | 36 | 69 | 9 |
2024-25 Pacific Division Standings
| TEAM | W | L | PTS | OTL |
|---|---|---|---|---|
 Vegas Vegas |
45 | 21 | 98 | 8 |
 Los Angeles Los Angeles |
42 | 23 | 93 | 9 |
 Edmonton Edmonton |
43 | 26 | 91 | 5 |
 Calgary Calgary |
35 | 27 | 82 | 12 |
 Vancouver Vancouver |
34 | 28 | 81 | 13 |
 Anaheim Anaheim |
33 | 33 | 74 | 8 |
 Seattle Seattle |
32 | 38 | 70 | 6 |
 San Jose San Jose |
20 | 44 | 50 | 10 |

