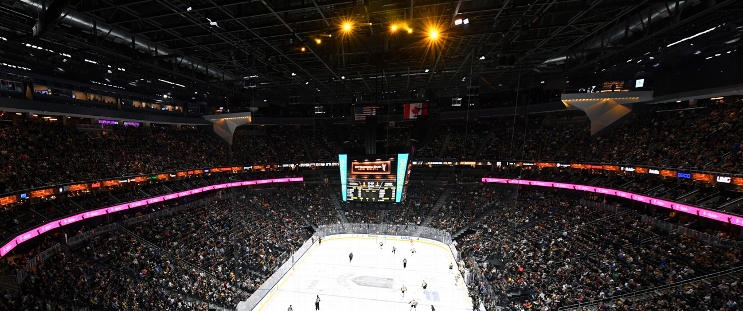
Columbus Blue Jackets at Vegas Golden Knights
· National Hockey LeagueSillinger's OT goal and Merzlikins' 25 saves give Blue Jackets 2-1 win over Golden Knights

Adam Fantilli, skating in his 100th career game, scored the other Blue Jackets goal, and Elvis Merzlikins stopped 25 shots.
Tomas Hertl scored his 20th goal of the season for the Golden Knights and Ilya Samsonov made 22 saves.
Hertl extended his point streak to 11 games (nine goals, six assists), just one off the club record set by Jack Eichel during the 2023-24 season. It is the NHL's longest active streak. Hertl also had eight goals in his past eight games.
Columbus has points in 10 of the past 12 games, going 9-2-1.
By picking up a point, the Golden Knights remained in a tie for first place in the Pacific Division with the Edmonton Oilers with 68 points.
Eichel's goal streak (three games) and point streak (seven) ended.
Golden Knights: Vegas was top heavy with its top two lines totaling 25 scoring chances to 17 for Columbus. The bottom lines were another story, with the Blue Jackets having the decided edge at 11-4.
CBJ lead series 1-0
Scoring Summary
 |
Goal | 1st Period 4:58 | Tomas Hertl Goal (20) Snap Shot, assists: Pavel Dorofeyev (12), Nicolas Hague (4) |
 |
Goal | 1st Period 18:34 | Adam Fantilli Goal (15) Wrist Shot, assists: Dmitri Voronkov (16) |
 |
Goal | 4th Period 0:52 | Cole Sillinger Goal (8) Snap Shot, assists: Zach Werenski (39), Kent Johnson (18) |
Statistics
 CBJ CBJ |
 VGK VGK |
|
|---|---|---|
| 13 | Blocked Shots | 11 |
| 18 | Hits | 10 |
| 5 | Takeaways | 4 |
| 24 | Shots | 26 |
| 0 | Power Play Goals | 0 |
| 1 | Power Play Opportunities | 1 |
| 0.0 | Power Play Percentage | 0.0 |
| 0 | Short Handed Goals | 0 |
| 0 | Shootout Goals | 0 |
| 19 | Faceoffs Won | 27 |
| 41.3 | Faceoff Win Percent | 58.7 |
| 17 | Giveaways | 11 |
| 1 | Total Penalties | 1 |
| 2 | Penalty Minutes | 2 |
 Vegas Golden Knights Injuries
| NAME, POS | STATUS | DATE |
|---|---|---|
| Ilya Samsonov, G | Day-To-Day | Apr 2 |
 Columbus Blue Jackets Injuries
| NAME, POS | STATUS | DATE |
|---|---|---|
| Owen Sillinger, C | Out | Mar 18 |
Game Information
 T-Mobile Arena
Location: Las Vegas, NV
Attendance: 17,783 | Capacity:

Location: Las Vegas, NV
Attendance: 17,783 | Capacity:
2024-25 Metropolitan Division Standings
| TEAM | W | L | PTS | OTL |
|---|---|---|---|---|
 Washington Washington |
48 | 18 | 105 | 9 |
 Carolina Carolina |
46 | 24 | 96 | 4 |
 New Jersey New Jersey |
40 | 29 | 87 | 7 |
 NY Rangers NY Rangers |
36 | 32 | 79 | 7 |
 Columbus Columbus |
34 | 30 | 77 | 9 |
 NY Islanders NY Islanders |
32 | 32 | 74 | 10 |
 Pittsburgh Pittsburgh |
30 | 34 | 71 | 11 |
 Philadelphia Philadelphia |
31 | 36 | 71 | 9 |
2024-25 Pacific Division Standings
| TEAM | W | L | PTS | OTL |
|---|---|---|---|---|
 Vegas Vegas |
45 | 21 | 98 | 8 |
 Los Angeles Los Angeles |
42 | 23 | 93 | 9 |
 Edmonton Edmonton |
43 | 26 | 91 | 5 |
 Calgary Calgary |
35 | 27 | 82 | 12 |
 Vancouver Vancouver |
34 | 28 | 81 | 13 |
 Anaheim Anaheim |
33 | 33 | 74 | 8 |
 Seattle Seattle |
32 | 38 | 70 | 6 |
 San Jose San Jose |
20 | 44 | 50 | 10 |

