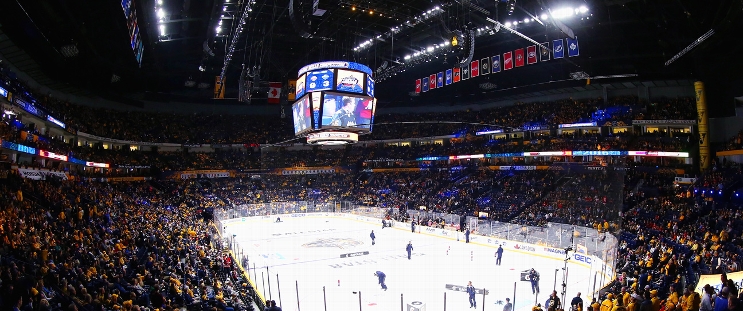
Vancouver Canucks at Nashville Predators
· National Hockey LeagueLinus Karlsson gets 1st NHL goal as Canucks beat Predators 3-1

Nils Hoglander and Pius Suter also scored, and Quinn Hughes had two assists and for the Canucks, who have won three straight. Thatcher Demko made 31 saves.
Tommy Novak scored and Juuse Saros had 19 saves for the Predators, losers of two straight.
Early in the second period, Tyler Myers fired a pass from the left faceoff dot to Karlsson standing just off of the right goalpost, where he had a tap-in for his first career goal at 1:28 to put the Canucks up 2-1.
Hoglander scored the game’s first goal at 7:11 of the opening period. He had the puck on the right side before toe-dragging into the slot and beating Saros with a wrist shot.
Novak tied the score 1:30 later.
Suter scored an empty-net goal in the final minute.
Predators: After winning a season-high five consecutive games, the Predators have dropped their last two. The winning streak gave the team faint hopes of rejoining the playoff race, but losing to teams they are chasing in the standings makes it more difficult.
NSH wins series 2-1
Scoring Summary
 |
Goal | 1st Period 7:11 | Nils Hoglander Goal (4) Wrist Shot, assists: Quinn Hughes (43), Elias Pettersson (21) |
 |
Goal | 1st Period 8:41 | Tommy Novak Goal (8) Deflected, assists: Zachary L'Heureux (9), Justin Barron (2) |
 |
Goal | 2nd Period 1:28 | Linus Karlsson Goal (1) Tip-In, assists: Tyler Myers (13), Quinn Hughes (44) |
 |
Goal | 3rd Period 19:41 | Pius Suter Goal (13) Wrist Shot, assists: Derek Forbort (4), J.T. Miller (26) |
Statistics
 VAN VAN |
 NSH NSH |
|
|---|---|---|
| 10 | Blocked Shots | 7 |
| 19 | Hits | 24 |
| 3 | Takeaways | 6 |
| 22 | Shots | 32 |
| 1 | Power Play Goals | 0 |
| 3 | Power Play Opportunities | 3 |
| 33.3 | Power Play Percentage | 0.0 |
| 0 | Short Handed Goals | 0 |
| 0 | Shootout Goals | 0 |
| 17 | Faceoffs Won | 33 |
| 34.0 | Faceoff Win Percent | 66.0 |
| 10 | Giveaways | 15 |
| 3 | Total Penalties | 3 |
| 6 | Penalty Minutes | 6 |
 Nashville Predators Injuries
| NAME, POS | STATUS | DATE |
|---|---|---|
| Jonathan Marchessault, RW | Day-To-Day | Apr 2 |
| Colton Sissons, C | Out | Mar 31 |
 Vancouver Canucks Injuries
| NAME, POS | STATUS | DATE |
|---|---|---|
| Nils Hoglander, LW | Out | Apr 2 |
| Elias Pettersson, C | Out | Apr 1 |
| Filip Chytil, C | Out | Apr 1 |
Game Information
 Bridgestone Arena
Location: Nashville, TN
Attendance: 17,159 | Capacity:

Location: Nashville, TN
Attendance: 17,159 | Capacity:
2024-25 Pacific Division Standings
| TEAM | W | L | PTS | OTL |
|---|---|---|---|---|
 Vegas Vegas |
45 | 21 | 98 | 8 |
 Los Angeles Los Angeles |
42 | 23 | 93 | 9 |
 Edmonton Edmonton |
43 | 26 | 91 | 5 |
 Calgary Calgary |
35 | 27 | 82 | 12 |
 Vancouver Vancouver |
34 | 27 | 81 | 13 |
 Anaheim Anaheim |
33 | 33 | 74 | 8 |
 Seattle Seattle |
31 | 38 | 68 | 6 |
 San Jose San Jose |
20 | 44 | 50 | 10 |
2024-25 Central Division Standings
| TEAM | W | L | PTS | OTL |
|---|---|---|---|---|
 Winnipeg Winnipeg |
51 | 20 | 106 | 4 |
 Dallas Dallas |
49 | 21 | 102 | 4 |
 Colorado Colorado |
45 | 26 | 94 | 4 |
 Minnesota Minnesota |
41 | 28 | 89 | 7 |
 St. Louis St. Louis |
41 | 28 | 89 | 7 |
 Utah Utah |
34 | 29 | 80 | 12 |
 Nashville Nashville |
27 | 40 | 62 | 8 |
 Chicago Chicago |
21 | 44 | 51 | 9 |

