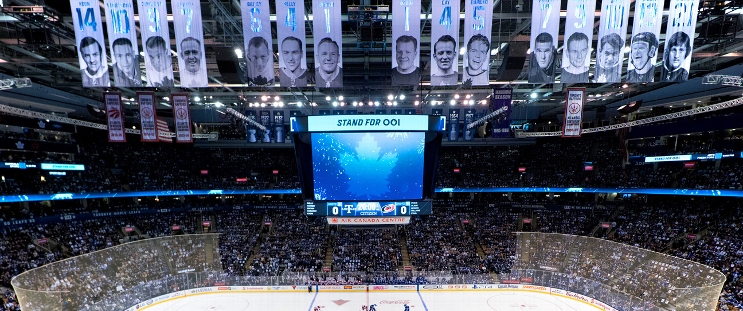
Minnesota Wild at Toronto Maple Leafs
· National Hockey LeagueWild win 3-1 to hand Maple Leafs third straight regulation loss

Marcus Foligno added an empty-netter in the final minute as Minnesota won its second straight to improve to 3-5-0 in their last eight games.
William Nylander scored for Toronto, which has lost three straight in regulation. Joseph Woll had 22 saves.
The Wild were without leading-scorer Kirill Kaprizov (lower-body injury), who is is set to undergo surgery and is expected to miss at least four weeks.
Khusnutdinov scored 7:07 into the game and Spurgeon made it 2-0 with 4:25 to go in the opening period.
Maple Leafs captain Auston Matthews hit the post on a shot through traffic later in the period before Nylander rattled Gustavsson’s crossbar on a breakaway in the second.
Nylander cut the deficit in half at 8:6 of the third with his team-leading 29th goal of the season, but Foligno iced it late with Woll on the bench for an extra attacker.
Maple Leafs: Max Pacioretty (upper-body injury) returned to the lineup following a three-game absence.
MIN wins series 2-0
Scoring Summary
 |
Goal | 1st Period 7:07 | Marat Khusnutdinov Goal (2) Snap Shot, assists: Jakub Lauko (3), Devin Shore (2) |
 |
Goal | 1st Period 15:35 | Jared Spurgeon Goal (6) Wrist Shot, assists: Mats Zuccarello (24), Joel Eriksson Ek (14) |
 |
Goal | 3rd Period 8:16 | William Nylander Goal (29) Wrist Shot, assists: Pontus Holmberg (6), Max Domi (15) |
 |
Goal | 3rd Period 19:45 | Marcus Foligno Goal (9) Poke, assists: Frederick Gaudreau (12) |
Statistics
 MIN MIN |
 TOR TOR |
|
|---|---|---|
| 22 | Blocked Shots | 8 |
| 12 | Hits | 23 |
| 5 | Takeaways | 5 |
| 25 | Shots | 33 |
| 1 | Power Play Goals | 0 |
| 1 | Power Play Opportunities | 1 |
| 100.0 | Power Play Percentage | 0.0 |
| 0 | Short Handed Goals | 0 |
| 0 | Shootout Goals | 0 |
| 19 | Faceoffs Won | 32 |
| 37.3 | Faceoff Win Percent | 62.7 |
| 15 | Giveaways | 13 |
| 1 | Total Penalties | 1 |
| 2 | Penalty Minutes | 2 |
Game Information
 Scotiabank Arena
Location: Toronto, ON
Attendance: 18,544 | Capacity:

Location: Toronto, ON
Attendance: 18,544 | Capacity:
2024-25 Central Division Standings
| TEAM | W | L | PTS | OTL |
|---|---|---|---|---|
 Winnipeg Winnipeg |
44 | 16 | 92 | 4 |
 Dallas Dallas |
41 | 20 | 84 | 2 |
 Colorado Colorado |
38 | 24 | 78 | 2 |
 Minnesota Minnesota |
36 | 23 | 76 | 4 |
 St. Louis St. Louis |
31 | 27 | 69 | 7 |
 Utah Utah |
28 | 25 | 66 | 10 |
 Nashville Nashville |
24 | 32 | 55 | 7 |
 Chicago Chicago |
20 | 35 | 49 | 9 |
2024-25 Atlantic Division Standings
| TEAM | W | L | PTS | OTL |
|---|---|---|---|---|
 Florida Florida |
40 | 21 | 83 | 3 |
 Toronto Toronto |
38 | 22 | 79 | 3 |
 Tampa Bay Tampa Bay |
37 | 22 | 78 | 4 |
 Ottawa Ottawa |
32 | 25 | 69 | 5 |
 Detroit Detroit |
30 | 27 | 66 | 6 |
 Montreal Montreal |
30 | 27 | 66 | 6 |
 Boston Boston |
29 | 28 | 66 | 8 |
 Buffalo Buffalo |
24 | 32 | 54 | 6 |

