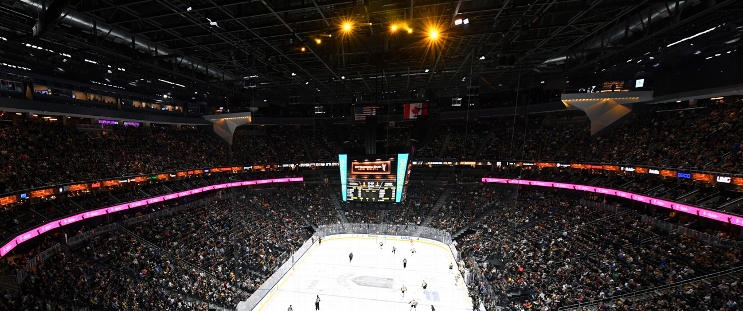
Florida Panthers at Vegas Golden Knights
· National Hockey LeagueGolden Knights open homestand with 4-1 victory over defending champion Panthers

The Golden Knights came in losers of seven of their last nine and got a much-needed victory over the defending Stanley Cup champions to open their three-game homestand.
Brayden McNabb, Jack Eichel and Tomas Hertl also scored for Vegas, and Nic Roy had three assists. Anton Lundell scored for Florida, and Spencer Knight stopped 22 shots.
The Panthers were playing their fourth road game in six nights and were on the second leg of a back-to-back after beating San Jose 7-2 on Saturday night.
The Golden Knights reclaimed sole possession of first place in the Pacific Division, moving a point in front of Edmonton.
Vegas: Just before the game, the Golden Knights announced defenseman Alex Pietrangelo was withdrawing from the 4 Nations Faceoff. Pietrangelo played 24:22 against the Panthers.
Series tied 1-1
Scoring Summary
 |
Goal | 1st Period 5:26 | Brayden McNabb Goal (3) Slap Shot, assists: Keegan Kolesar (10), Nicolas Roy (9) |
 |
Goal | 2nd Period 5:40 | Tanner Pearson Goal (9) Wrist Shot, assists: Nicolas Roy (10), Keegan Kolesar (11) |
 |
Goal | 3rd Period 1:56 | Anton Lundell Goal (12) Tip-In, assists: Eetu Luostarinen (10), Uvis Balinskis (11) |
 |
Goal | 3rd Period 11:31 | Jack Eichel Goal (15) Wrist Shot, assists: Ivan Barbashev (17), Alexander Holtz (8) |
 |
Goal | 3rd Period 19:31 | Tomas Hertl Goal (18) Wrist Shot, assists: Nicolas Roy (11), Brayden McNabb (8) |
Statistics
 FLA FLA |
 VGK VGK |
|
|---|---|---|
| 14 | Blocked Shots | 16 |
| 36 | Hits | 14 |
| 2 | Takeaways | 3 |
| 34 | Shots | 26 |
| 0 | Power Play Goals | 0 |
| 3 | Power Play Opportunities | 2 |
| 0.0 | Power Play Percentage | 0.0 |
| 0 | Short Handed Goals | 0 |
| 0 | Shootout Goals | 0 |
| 32 | Faceoffs Won | 35 |
| 47.8 | Faceoff Win Percent | 52.2 |
| 15 | Giveaways | 15 |
| 2 | Total Penalties | 3 |
| 4 | Penalty Minutes | 6 |
 Vegas Golden Knights Injuries
| NAME, POS | STATUS | DATE |
|---|
 Florida Panthers Injuries
| NAME, POS | STATUS | DATE |
|---|---|---|
| Aleksander Barkov, C | Day-To-Day | Apr 25 |
Game Information
 T-Mobile Arena
Location: Las Vegas, NV
Attendance: 17,716 | Capacity:

Location: Las Vegas, NV
Attendance: 17,716 | Capacity:
2024-25 Atlantic Division Standings
| TEAM | W | L | PTS | OTL |
|---|---|---|---|---|
 Toronto Toronto |
52 | 26 | 108 | 4 |
 Tampa Bay Tampa Bay |
47 | 27 | 102 | 8 |
 Florida Florida |
47 | 31 | 98 | 4 |
 Ottawa Ottawa |
45 | 30 | 97 | 7 |
 Montreal Montreal |
40 | 31 | 91 | 11 |
 Detroit Detroit |
39 | 35 | 86 | 8 |
 Buffalo Buffalo |
36 | 39 | 79 | 7 |
 Boston Boston |
33 | 39 | 76 | 10 |
2024-25 Pacific Division Standings
| TEAM | W | L | PTS | OTL |
|---|---|---|---|---|
 Vegas Vegas |
50 | 22 | 110 | 10 |
 Los Angeles Los Angeles |
48 | 25 | 105 | 9 |
 Edmonton Edmonton |
48 | 29 | 101 | 5 |
 Calgary Calgary |
41 | 27 | 96 | 14 |
 Vancouver Vancouver |
38 | 30 | 90 | 14 |
 Anaheim Anaheim |
35 | 37 | 80 | 10 |
 Seattle Seattle |
35 | 41 | 76 | 6 |
 San Jose San Jose |
20 | 50 | 52 | 12 |

