Florida Panthers at San Jose Sharks
· National Hockey LeagueAaron Ekblad scores in return from injury in the Panthers' 7-2 victory over the Sharks

Matthew Tkachuk had a goal and two assists, and Nate Schmidt, Sam Bennett, A.J. Greer, Jesper Boqvist and Sam Reinhart also scored. Sergei Bobrovsky made 22 saves.
Florida outscored San Jose 4-0 in the second period, extending a 3-2 lead into a blowout.
Cody Ceci and Will Smith scored for the Sharks. They have lost six straight and 10 of 11.
Greer put the Panthers up 4-2 early in the second, chasing goalie Alexandar Georgiev, who was replaced by Yaroslav Askarov. Tkachuk, Boqvist and Reinhart promptly added goals to give the Panthers a 7-2 lead heading into the third.
The Panthers led 3-2 after the first period with Ekblad, who returned to Florida’s top defensive pairing after missing eight of the last nine games, giving the Panthers the lead.
Sharks: They have allowed at least five goals in each of the last three games. They've given up the most goals in the NHL this season.
FLA wins series 2-0
Scoring Summary
 |
Goal | 1st Period 5:47 | Nate Schmidt Goal (4) Slap Shot, assists: none |
 |
Goal | 1st Period 6:50 | Cody Ceci Goal (4) Tip-In, assists: Jake Walman (22) |
 |
Goal | 1st Period 7:22 | Will Smith Goal (8) Snap Shot, assists: Mario Ferraro (6), Fabian Zetterlund (18) |
 |
Goal | 1st Period 14:27 | Sam Bennett Goal (15) Deflected, assists: A.J. Greer (7), Niko Mikkola (12) |
 |
Goal | 1st Period 17:08 | Aaron Ekblad Goal (3) Snap Shot, assists: Matthew Tkachuk (28) |
 |
Goal | 2nd Period 3:01 | A.J. Greer Goal (5) Backhand, assists: Tomas Nosek (8) |
 |
Goal | 2nd Period 5:35 | Matthew Tkachuk Goal (15) Tip-In, assists: Aleksander Barkov (29), Aaron Ekblad (19) |
 |
Goal | 2nd Period 13:07 | Jesper Boqvist Goal (12) Wrist Shot, assists: Anton Lundell (21), Carter Verhaeghe (24) |
 |
Goal | 2nd Period 16:25 | Sam Reinhart Goal (29) Backhand, assists: Matthew Tkachuk (29), Aleksander Barkov (30) |
Statistics
 FLA FLA |
 SJ SJ |
|
|---|---|---|
| 9 | Blocked Shots | 20 |
| 19 | Hits | 22 |
| 2 | Takeaways | 3 |
| 32 | Shots | 23 |
| 1 | Power Play Goals | 0 |
| 2 | Power Play Opportunities | 1 |
| 50.0 | Power Play Percentage | 0.0 |
| 0 | Short Handed Goals | 0 |
| 0 | Shootout Goals | 0 |
| 29 | Faceoffs Won | 26 |
| 52.7 | Faceoff Win Percent | 47.3 |
| 11 | Giveaways | 10 |
| 1 | Total Penalties | 2 |
| 2 | Penalty Minutes | 4 |
 San Jose Sharks Injuries
| NAME, POS | STATUS | DATE |
|---|---|---|
| Shakir Mukhamadullin, D | Out | Apr 17 |
| Thomas Bordeleau, C | Out | Apr 16 |
| Vincent Desharnais, D | Out | Apr 15 |
| Logan Couture, C | Injured Reserve | Apr 14 |
| Klim Kostin, C | Out | Apr 13 |
 Florida Panthers Injuries
| NAME, POS | STATUS | DATE |
|---|---|---|
| Aleksander Barkov, C | Day-To-Day | Apr 25 |
Game Information
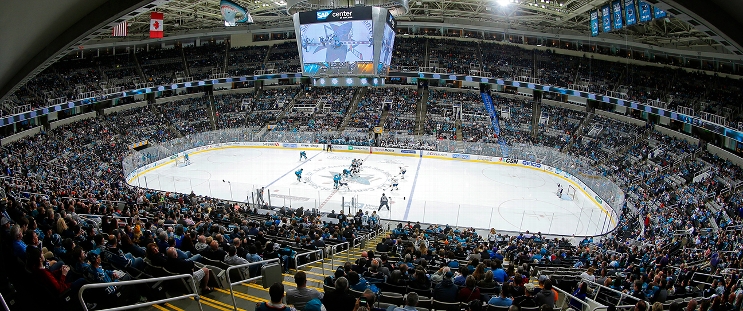
 SAP Center at San Jose
Location: San Jose, CA
Attendance: 17,435 | Capacity:

Location: San Jose, CA
Attendance: 17,435 | Capacity:
2024-25 Atlantic Division Standings
| TEAM | W | L | PTS | OTL |
|---|---|---|---|---|
 Toronto Toronto |
52 | 26 | 108 | 4 |
 Tampa Bay Tampa Bay |
47 | 27 | 102 | 8 |
 Florida Florida |
47 | 31 | 98 | 4 |
 Ottawa Ottawa |
45 | 30 | 97 | 7 |
 Montreal Montreal |
40 | 31 | 91 | 11 |
 Detroit Detroit |
39 | 35 | 86 | 8 |
 Buffalo Buffalo |
36 | 39 | 79 | 7 |
 Boston Boston |
33 | 39 | 76 | 10 |
2024-25 Pacific Division Standings
| TEAM | W | L | PTS | OTL |
|---|---|---|---|---|
 Vegas Vegas |
50 | 22 | 110 | 10 |
 Los Angeles Los Angeles |
48 | 25 | 105 | 9 |
 Edmonton Edmonton |
48 | 29 | 101 | 5 |
 Calgary Calgary |
41 | 27 | 96 | 14 |
 Vancouver Vancouver |
38 | 30 | 90 | 14 |
 Anaheim Anaheim |
35 | 37 | 80 | 10 |
 Seattle Seattle |
35 | 41 | 76 | 6 |
 San Jose San Jose |
20 | 50 | 52 | 12 |

