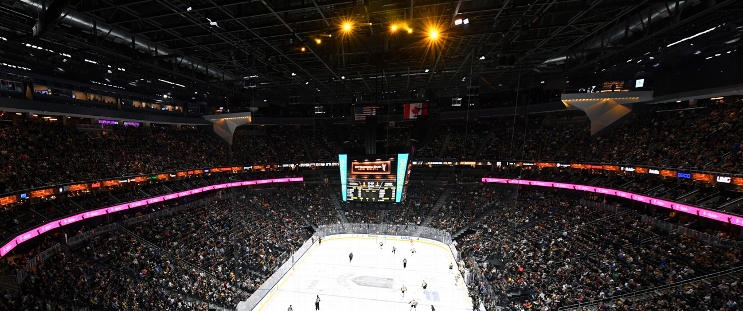
New York Rangers at Vegas Golden Knights
· National Hockey LeagueEdstrom's 3rd-period goal gives Rangers 2-1 win over the Golden Knights

The Rangers are 4-1-1 since getting outscored 19-6 during a four-game skid. After beating New Jersey 3-2 in overtime Thursday, they've won consecutive games for the first time since a three-game streak from Nov. 14-19.
Vegas, defeated 4-0 on Thursday night by the New York Islanders, lost consecutive games for the first time since Nov. 17 and 20.
Vincent Trocheck scored the other New York goal on a power play, and Igor Shesterkin made 29 saves.
Mark Stone scored on a power play for the Golden Knights. Ilya Samsonov stopped 24 shots.
Vegas' Ivan Barbashev returned after missing 10 games because of an upper-body injury. Even with the missed time, his 15 goals are tied with Brett Howden for the team lead. Barbashev didn't waste any time trying to make an impact, taking a shot on goal 17 seconds into the game.
Golden Knights: Vegas was fourth in scoring entering the game with an average of 3.46 goals. The Golden Knights have totaled one goal in back-to-back losses.
NYR lead series 1-0
Scoring Summary
 |
Goal | 2nd Period 6:16 | Mark Stone Goal (12) Wrist Shot, assists: Jack Eichel (43), Tomas Hertl (16) |
 |
Goal | 2nd Period 9:54 | Vincent Trocheck Goal (14) Wrist Shot, assists: Mika Zibanejad (19), Artemi Panarin (28) |
 |
Goal | 3rd Period 5:57 | Adam Edstrom Goal (3) Tip-In, assists: Jonny Brodzinski (3), Matt Rempe (1) |
Statistics
 NYR NYR |
 VGK VGK |
|
|---|---|---|
| 21 | Blocked Shots | 11 |
| 14 | Hits | 21 |
| 5 | Takeaways | 3 |
| 26 | Shots | 30 |
| 1 | Power Play Goals | 1 |
| 1 | Power Play Opportunities | 3 |
| 100.0 | Power Play Percentage | 33.3 |
| 0 | Short Handed Goals | 0 |
| 0 | Shootout Goals | 0 |
| 18 | Faceoffs Won | 37 |
| 32.7 | Faceoff Win Percent | 67.3 |
| 11 | Giveaways | 18 |
| 3 | Total Penalties | 1 |
| 6 | Penalty Minutes | 2 |
Game Information
 T-Mobile Arena
Location: Las Vegas, NV
Attendance: 18,144 | Capacity:

Location: Las Vegas, NV
Attendance: 18,144 | Capacity:
2024-25 Metropolitan Division Standings
| TEAM | W | L | PTS | OTL |
|---|---|---|---|---|
 Washington Washington |
36 | 11 | 80 | 8 |
 Carolina Carolina |
33 | 19 | 70 | 4 |
 New Jersey New Jersey |
31 | 20 | 68 | 6 |
 Columbus Columbus |
26 | 22 | 60 | 8 |
 NY Rangers NY Rangers |
27 | 24 | 58 | 4 |
 NY Islanders NY Islanders |
25 | 23 | 57 | 7 |
 Pittsburgh Pittsburgh |
23 | 25 | 55 | 9 |
 Philadelphia Philadelphia |
24 | 26 | 55 | 7 |
2024-25 Pacific Division Standings
| TEAM | W | L | PTS | OTL |
|---|---|---|---|---|
 Edmonton Edmonton |
34 | 17 | 72 | 4 |
 Vegas Vegas |
33 | 17 | 72 | 6 |
 Los Angeles Los Angeles |
29 | 17 | 65 | 7 |
 Vancouver Vancouver |
26 | 18 | 63 | 11 |
 Calgary Calgary |
26 | 21 | 60 | 8 |
 Anaheim Anaheim |
24 | 24 | 54 | 6 |
 Seattle Seattle |
24 | 29 | 52 | 4 |
 San Jose San Jose |
15 | 35 | 37 | 7 |

