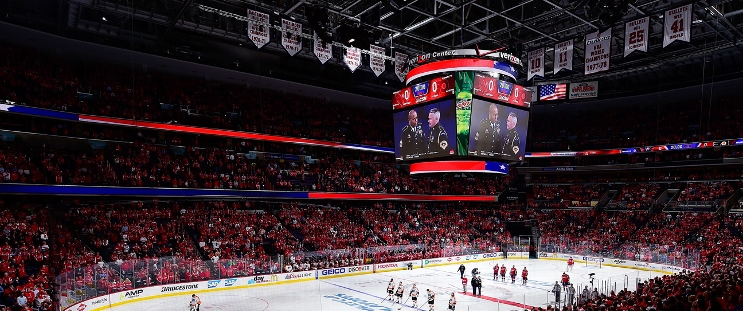
Montreal Canadiens at Washington Capitals
· National Hockey League
Regular Season Series
WSH leads series 2-0
Statistics
 MTL MTL |
 WSH WSH |
|
|---|---|---|
| 3.38 | Goals Against Average | 2.65 |
| 28.9 | Shots Against per Game | 27.6 |
| 82.0 | Penalty Kill Percentage | 83.7 |
| 25 | Power Play Goals Against | 20 |
| 0 | Short Handed Goals Against | 0 |
| 3.00 | Goals For per Game | 3.70 |
| 25.4 | Shots per Game | 28.2 |
| 27 | Power Play Goals | 28 |
| 22.1 | Power Play Percentage | 23.9 |
| 4 | Short Handed Goals | 3 |
| 401 | Penalty Minutes | 346 |
 Washington Capitals Injuries
| NAME, POS | STATUS | DATE |
|---|---|---|
| Martin Fehervary, D | Day-To-Day | Jan 1 |
| Alex Ovechkin, LW | Injured Reserve | Dec 28 |
| Lars Eller, C | Injured Reserve | Dec 20 |
| Andrew Mangiapane, LW | Day-To-Day | Dec 17 |
| Tom Wilson, RW | Day-To-Day | Dec 9 |
 Montreal Canadiens Injuries
| NAME, POS | STATUS | DATE |
|---|---|---|
| David Savard, D | Day-To-Day | Jan 7 |
| Patrik Laine, LW | Day-To-Day | Jan 7 |
| Alexandre Carrier, D | Injured Reserve | Dec 19 |
| Kaiden Guhle, D | Day-To-Day | Dec 6 |
| Rafael Harvey-Pinard, LW | Injured Reserve | Nov 30 |
Game Information
 Capital One Arena
Location: Washington, DC
Capacity:

Capital One Arena
Location: Washington, DC
Capacity:
2024-25 Atlantic Division Standings
| TEAM | W | L | PTS | OTL |
|---|---|---|---|---|
 Toronto Toronto |
27 | 13 | 56 | 2 |
 Florida Florida |
24 | 15 | 50 | 2 |
 Boston Boston |
20 | 18 | 45 | 5 |
 Tampa Bay Tampa Bay |
21 | 15 | 44 | 2 |
 Ottawa Ottawa |
19 | 17 | 41 | 3 |
 Montreal Montreal |
19 | 18 | 41 | 3 |
 Detroit Detroit |
18 | 18 | 40 | 4 |
 Buffalo Buffalo |
15 | 21 | 35 | 5 |
2024-25 Metropolitan Division Standings
| TEAM | W | L | PTS | OTL |
|---|---|---|---|---|
 Washington Washington |
27 | 10 | 58 | 4 |
 New Jersey New Jersey |
25 | 15 | 53 | 3 |
 Carolina Carolina |
24 | 15 | 50 | 2 |
 Columbus Columbus |
18 | 17 | 42 | 6 |
 Pittsburgh Pittsburgh |
17 | 17 | 42 | 8 |
 Philadelphia Philadelphia |
17 | 19 | 39 | 5 |
 NY Rangers NY Rangers |
18 | 20 | 38 | 2 |
 NY Islanders NY Islanders |
15 | 18 | 37 | 7 |


 VGK
VGK CHI
CHI COL
COL VAN
VAN MIN
MIN