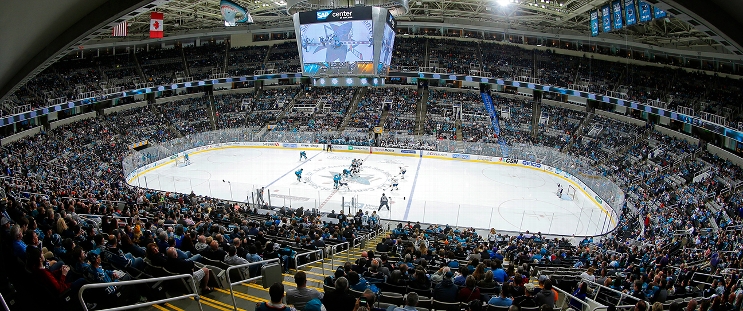
Vegas Golden Knights at San Jose Sharks
· National Hockey LeagueStone leads Golden Knights past Sharks 4-2 for 3rd straight win

Zach Whitecloud, Victor Olofsson and Tomas Hertl also scored to help Vegas extend its winning streak to three games. Shea Theodore had two assists.
William Eklund had a goal and an assist for San Jose. Timothy Liljegren also scored.
Olofsson gave the Golden Knights a 3-1 lead on a power play at 1:10 of the third period. His ninth goal came on a slap shot from the circle off a backhand pass from Jack Eichel.
Liljegren's power-play goal trimmed it to 3-2 at 10:41, but Hertl sealed it with an empty-netter.
Vegas goalie Ilya Samsonov made 20 saves. Sharks netminder Alexandar Georgiev turned back 38 shots.
Sharks: After opening the calendar year with two consecutive wins, San Jose lost for the ninth time in 11 games.
VGK wins series 3-0
Scoring Summary
 |
Goal | 1st Period 8:39 | Mark Stone Goal (11) Wrist Shot, assists: Shea Theodore (28), William Karlsson (11) |
 |
Goal | 1st Period 10:08 | Zach Whitecloud Goal (3) Wrist Shot, assists: Brett Howden (6), Keegan Kolesar (9) |
 |
Goal | 2nd Period 9:49 | William Eklund Goal (8) Wrist Shot, assists: Collin Graf (2), Alexander Wennberg (12) |
 |
Goal | 3rd Period 1:10 | Victor Olofsson Goal (9) Slap Shot, assists: Jack Eichel (42), Shea Theodore (29) |
 |
Goal | 3rd Period 10:41 | Timothy Liljegren Goal (4) Wrist Shot, assists: William Eklund (22), Fabian Zetterlund (16) |
 |
Goal | 3rd Period 18:40 | Tomas Hertl Goal (11) Wrist Shot, assists: Mark Stone (24) |
Statistics
 VGK VGK |
 SJ SJ |
|
|---|---|---|
| 19 | Blocked Shots | 15 |
| 25 | Hits | 28 |
| 5 | Takeaways | 4 |
| 42 | Shots | 21 |
| 1 | Power Play Goals | 2 |
| 1 | Power Play Opportunities | 2 |
| 100.0 | Power Play Percentage | 100.0 |
| 0 | Short Handed Goals | 0 |
| 0 | Shootout Goals | 0 |
| 34 | Faceoffs Won | 17 |
| 66.7 | Faceoff Win Percent | 33.3 |
| 14 | Giveaways | 10 |
| 2 | Total Penalties | 1 |
| 4 | Penalty Minutes | 2 |
Game Information
 SAP Center at San Jose
Location: San Jose, CA
Attendance: 10,802 | Capacity:

Location: San Jose, CA
Attendance: 10,802 | Capacity:
2024-25 Pacific Division Standings
| TEAM | W | L | PTS | OTL |
|---|---|---|---|---|
 Edmonton Edmonton |
34 | 17 | 72 | 4 |
 Vegas Vegas |
33 | 17 | 72 | 6 |
 Los Angeles Los Angeles |
29 | 17 | 65 | 7 |
 Vancouver Vancouver |
26 | 18 | 63 | 11 |
 Calgary Calgary |
26 | 21 | 60 | 8 |
 Anaheim Anaheim |
24 | 24 | 54 | 6 |
 Seattle Seattle |
24 | 29 | 52 | 4 |
 San Jose San Jose |
15 | 35 | 37 | 7 |

