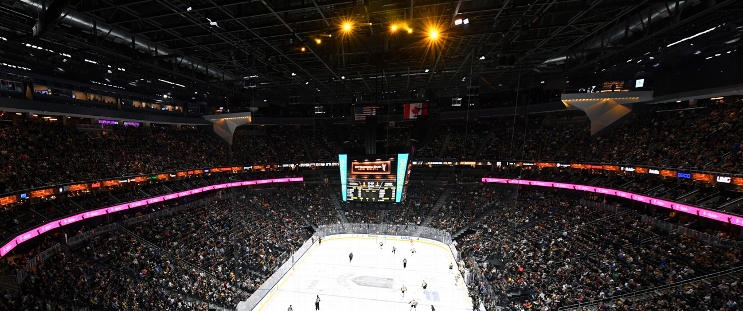
Buffalo Sabres at Vegas Golden Knights
· National Hockey LeagueLaczynski gets 1st goal of season, Hill has 23 saves as Golden Knights beat Sabres 3-1

The Golden Knights have totaled a league-high 33 points while going 16-3-1 since Nov. 21 to take over the No. 1 spot in the NHL with 57 points — leapfrogging Winnipeg, which Jets, which lost to Detroit.
Mark Stone and Jack Eichel also scored for Vegas, while Tanner Pearson added two assists.
Jason Zucker scored for Buffalo and James Reimer made 30 saves. The Sabres closed out a four-game road trip with a third-straight loss.
Golden Knights: During Vegas’ 20-game stretch since Nov. 21, it’s allowed a league-low 2.20 goals per game. The Knights have allowed two goals or fewer in 14 of those games.
----
Regular Season SeriesVGK leads series 1-0
Scoring Summary
 |
Goal | 1st Period 4:53 | Tanner Laczynski Goal (1) Snap Shot, assists: Brett Howden (5), Zach Whitecloud (3) |
 |
Goal | 1st Period 12:23 | Mark Stone Goal (10) Snap Shot, assists: Jack Eichel (41), Tanner Pearson (9) |
 |
Goal | 3rd Period 7:44 | Jack Eichel Goal (11) Snap Shot, assists: Tanner Pearson (10), Noah Hanifin (15) |
 |
Goal | 3rd Period 17:42 | Jason Zucker Goal (15) Tip-In, assists: Rasmus Dahlin (22), JJ Peterka (18) |
Statistics
 BUF BUF |
 VGK VGK |
|
|---|---|---|
| 10 | Blocked Shots | 17 |
| 17 | Hits | 19 |
| 5 | Takeaways | 6 |
| 24 | Shots | 33 |
| 1 | Power Play Goals | 0 |
| 3 | Power Play Opportunities | 2 |
| 33.3 | Power Play Percentage | 0.0 |
| 0 | Short Handed Goals | 0 |
| 0 | Shootout Goals | 0 |
| 27 | Faceoffs Won | 20 |
| 57.4 | Faceoff Win Percent | 42.6 |
| 22 | Giveaways | 15 |
| 2 | Total Penalties | 3 |
| 4 | Penalty Minutes | 6 |
Game Information
 T-Mobile Arena
Location: Las Vegas, NV
Attendance: 18,111 | Capacity:

Location: Las Vegas, NV
Attendance: 18,111 | Capacity:
2024-25 Atlantic Division Standings
| TEAM | W | L | PTS | OTL |
|---|---|---|---|---|
 Florida Florida |
34 | 20 | 71 | 3 |
 Toronto Toronto |
33 | 20 | 68 | 2 |
 Tampa Bay Tampa Bay |
31 | 20 | 66 | 4 |
 Ottawa Ottawa |
29 | 23 | 62 | 4 |
 Detroit Detroit |
28 | 22 | 61 | 5 |
 Boston Boston |
27 | 24 | 60 | 6 |
 Montreal Montreal |
25 | 26 | 55 | 5 |
 Buffalo Buffalo |
22 | 27 | 49 | 5 |
2024-25 Pacific Division Standings
| TEAM | W | L | PTS | OTL |
|---|---|---|---|---|
 Edmonton Edmonton |
34 | 17 | 72 | 4 |
 Vegas Vegas |
33 | 17 | 72 | 6 |
 Los Angeles Los Angeles |
29 | 17 | 65 | 7 |
 Vancouver Vancouver |
26 | 18 | 63 | 11 |
 Calgary Calgary |
26 | 21 | 60 | 8 |
 Anaheim Anaheim |
24 | 24 | 54 | 6 |
 Seattle Seattle |
24 | 29 | 52 | 4 |
 San Jose San Jose |
15 | 35 | 37 | 7 |

