
New Jersey Devils at San Jose Sharks
· National Hockey LeagueCody Ceci scores with 25 seconds left, Sharks beat Devils 3-2

With the game tied 2-2, Ceci’s slap shot from the point beat Devils goaltender Jacob Markstrom.
Yaroslav Askarov stopped 28 shots for San Jose, and Markstrom made 21 saves for New Jersey.
Macklin Celebrini gave the Sharks a 2-1 lead with a hard wrist shot on his first shift of the third period, but Paul Cotter answered for the Devils.
Nikolai Kovalenko scored his first goal with the Sharks late in the first period after joining the team in a trade last month. Nico Hischier, on his 26th birthday, tied the game in the second on the power play by deflecting the puck in off a pass by Jack Hughes.
Sharks: The Sharks won against a second consecutive playoff team after beating the Lightning on Thursday to snap an eight-game losing streak. Askarov, coming off a perfect third period on Thursday, looked solid in his second straight start as the Sharks are giving their goaltender of the future more experience.
SJ wins series 2-0
Scoring Summary
 |
Goal | 1st Period 17:40 | Nikolai Kovalenko Goal (5) Wrist Shot, assists: William Eklund (21), Luke Kunin (7) |
 |
Goal | 2nd Period 4:19 | Nico Hischier Goal (19) Deflected, assists: Jack Hughes (32), Jesper Bratt (34) |
 |
Goal | 3rd Period 1:53 | Macklin Celebrini Goal (13) Wrist Shot, assists: Will Smith (8), Collin Graf (1) |
 |
Goal | 3rd Period 5:07 | Paul Cotter Goal (9) Wrist Shot, assists: Luke Hughes (15) |
 |
Goal | 3rd Period 19:35 | Cody Ceci Goal (3) Slap Shot, assists: Alexander Wennberg (11) |
Statistics
 NJ NJ |
 SJ SJ |
|
|---|---|---|
| 12 | Blocked Shots | 16 |
| 21 | Hits | 16 |
| 3 | Takeaways | 1 |
| 30 | Shots | 24 |
| 1 | Power Play Goals | 0 |
| 2 | Power Play Opportunities | 4 |
| 50.0 | Power Play Percentage | 0.0 |
| 0 | Short Handed Goals | 0 |
| 0 | Shootout Goals | 0 |
| 36 | Faceoffs Won | 27 |
| 57.1 | Faceoff Win Percent | 42.9 |
| 10 | Giveaways | 11 |
| 4 | Total Penalties | 2 |
| 8 | Penalty Minutes | 4 |
 San Jose Sharks Injuries
| NAME, POS | STATUS | DATE |
|---|---|---|
| Shakir Mukhamadullin, D | Out | Apr 17 |
| Zack Ostapchuk, C | Out | Apr 16 |
| Thomas Bordeleau, C | Out | Apr 16 |
| Vincent Desharnais, D | Out | Apr 15 |
| Logan Couture, C | Injured Reserve | Apr 14 |
 New Jersey Devils Injuries
| NAME, POS | STATUS | DATE |
|---|---|---|
| Brenden Dillon, D | Day-To-Day | Apr 20 |
| Cody Glass, C | Day-To-Day | Apr 20 |
| Jonas Siegenthaler, D | Injured Reserve | Apr 20 |
Game Information
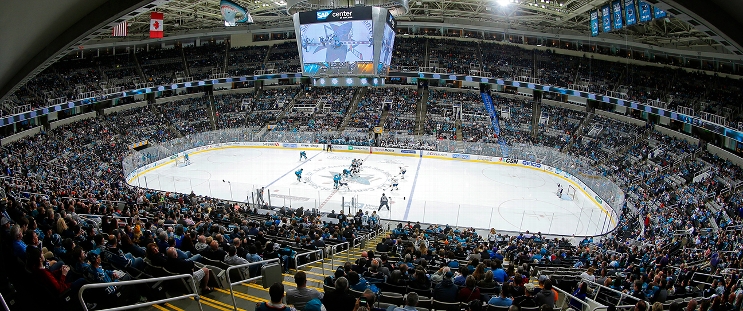 SAP Center at San Jose
Location: San Jose, CA
Attendance: 17,435 | Capacity:

Location: San Jose, CA
Attendance: 17,435 | Capacity:
2024-25 Metropolitan Division Standings
| TEAM | W | L | PTS | OTL |
|---|---|---|---|---|
 Washington Washington |
51 | 22 | 111 | 9 |
 Carolina Carolina |
47 | 30 | 99 | 5 |
 New Jersey New Jersey |
42 | 33 | 91 | 7 |
 Columbus Columbus |
40 | 33 | 89 | 9 |
 NY Rangers NY Rangers |
39 | 36 | 85 | 7 |
 NY Islanders NY Islanders |
35 | 35 | 82 | 12 |
 Pittsburgh Pittsburgh |
34 | 36 | 80 | 12 |
 Philadelphia Philadelphia |
33 | 39 | 76 | 10 |
2024-25 Pacific Division Standings
| TEAM | W | L | PTS | OTL |
|---|---|---|---|---|
 Vegas Vegas |
50 | 22 | 110 | 10 |
 Los Angeles Los Angeles |
48 | 25 | 105 | 9 |
 Edmonton Edmonton |
48 | 29 | 101 | 5 |
 Calgary Calgary |
41 | 27 | 96 | 14 |
 Vancouver Vancouver |
38 | 30 | 90 | 14 |
 Anaheim Anaheim |
35 | 37 | 80 | 10 |
 Seattle Seattle |
35 | 41 | 76 | 6 |
 San Jose San Jose |
20 | 50 | 52 | 12 |

