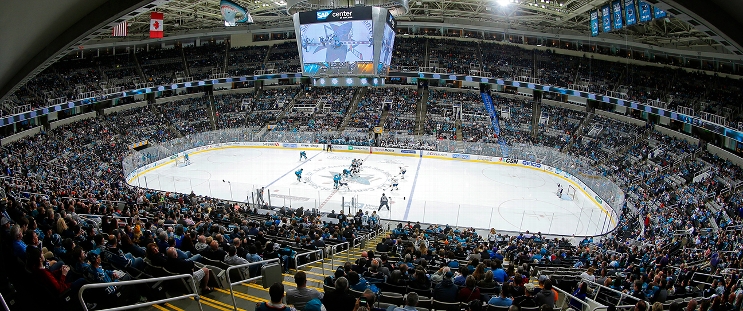
Tampa Bay Lightning at San Jose Sharks
· National Hockey LeagueThe Sharks beat the Lightning 2-1 for their 1st home win since November

Toffoli used a nifty toe drag to score his 15th goal of the season midway through the first and Ferraro added a goal in the second to give the Sharks their first home win since Nov. 29.
Yaroslav Askarov made 24 saves.
San Jose was 0-7-1 in its last eight games and had just one win in 12 games in a stretch that started with an 8-1 loss at Tampa on Dec. 5.
Anthony Cirelli scored for the Lightning. Andrei Vasilevskiy made 23 saves.
Sharks: After being completely outclassed in the loss at Tampa last month, the young Sharks looked much better on home ice against one of the NHL's top teams
Series tied 1-1
Scoring Summary
 |
Goal | 1st Period 13:52 | Tyler Toffoli Goal (15) Wrist Shot, assists: Marc-Edouard Vlasic (1), Jan Rutta (5) |
 |
Goal | 2nd Period 12:55 | Mario Ferraro Goal (3) Wrist Shot, assists: Mikael Granlund (24) |
 |
Goal | 2nd Period 17:44 | Anthony Cirelli Goal (15) Tip-In, assists: Erik Cernak (9), Brandon Hagel (25) |
Statistics
 TB TB |
 SJ SJ |
|
|---|---|---|
| 8 | Blocked Shots | 13 |
| 13 | Hits | 17 |
| 3 | Takeaways | 1 |
| 25 | Shots | 25 |
| 0 | Power Play Goals | 0 |
| 2 | Power Play Opportunities | 2 |
| 0.0 | Power Play Percentage | 0.0 |
| 0 | Short Handed Goals | 0 |
| 0 | Shootout Goals | 0 |
| 21 | Faceoffs Won | 17 |
| 55.3 | Faceoff Win Percent | 44.7 |
| 14 | Giveaways | 21 |
| 4 | Total Penalties | 4 |
| 11 | Penalty Minutes | 11 |
Game Information
 SAP Center at San Jose
Location: San Jose, CA
Attendance: 11,103 | Capacity:

Location: San Jose, CA
Attendance: 11,103 | Capacity:
2024-25 Atlantic Division Standings
| TEAM | W | L | PTS | OTL |
|---|---|---|---|---|
 Florida Florida |
34 | 20 | 71 | 3 |
 Toronto Toronto |
33 | 20 | 68 | 2 |
 Tampa Bay Tampa Bay |
31 | 20 | 66 | 4 |
 Ottawa Ottawa |
29 | 23 | 62 | 4 |
 Detroit Detroit |
28 | 22 | 61 | 5 |
 Boston Boston |
27 | 24 | 60 | 6 |
 Montreal Montreal |
25 | 26 | 55 | 5 |
 Buffalo Buffalo |
22 | 27 | 49 | 5 |
2024-25 Pacific Division Standings
| TEAM | W | L | PTS | OTL |
|---|---|---|---|---|
 Edmonton Edmonton |
34 | 17 | 72 | 4 |
 Vegas Vegas |
33 | 17 | 72 | 6 |
 Los Angeles Los Angeles |
29 | 17 | 65 | 7 |
 Vancouver Vancouver |
26 | 18 | 63 | 11 |
 Calgary Calgary |
26 | 21 | 60 | 8 |
 Anaheim Anaheim |
24 | 24 | 54 | 6 |
 Seattle Seattle |
24 | 29 | 52 | 4 |
 San Jose San Jose |
15 | 35 | 37 | 7 |

