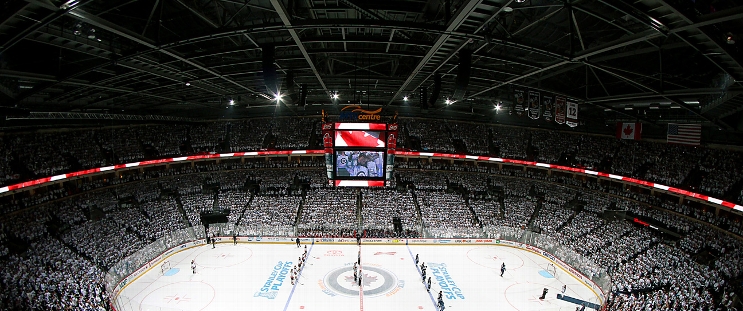
Anaheim Ducks at Winnipeg Jets
· National Hockey LeagueTroy Terry scores his 2nd goal of the game in OT to lift the Ducks past the Jets, 4-3

Terry added an assist in a three-point night, Radko Gudas and Leo Carlsson also scored and John Gibson stopped 27 shots for Anaheim. The Ducks improved to 16-17-4.
Gudas forced overtime when his screened shot from the point beat Connor Hellebuyck with 1:10 left in regulation and the Gibson off for an extra attacker.
Alex Iafallo gave Winnipeg a 3-2 lead with a wraparound with 2:44 left.
Adam Lowry and Mark Scheifele also scored for Winnipeg. The Jets have lost two in a row to fall to 27-11-2.
Jets: Jumped out to an early 2-0 lead, only to watch it disappear early in the second period.
ANA leads series 2-0
Scoring Summary
 |
Goal | 1st Period 0:33 | Mark Scheifele Goal (23) Wrist Shot, assists: Kyle Connor (30), Gabriel Vilardi (18) |
 |
Goal | 1st Period 17:17 | Adam Lowry Goal (10) Snap Shot, assists: Alex Iafallo (8), Josh Morrissey (32) |
 |
Goal | 1st Period 18:58 | Leo Carlsson Goal (8) Tip-In, assists: Radko Gudas (8), Alex Killorn (9) |
 |
Goal | 2nd Period 6:52 | Troy Terry Goal (12) Snap Shot, assists: Ryan Strome (13), Brian Dumoulin (8) |
 |
Goal | 3rd Period 17:16 | Alex Iafallo Goal (6) Wrap-around, assists: Nino Niederreiter (11), Josh Morrissey (33) |
 |
Goal | 3rd Period 18:10 | Radko Gudas Goal (1) Slap Shot, assists: Frank Vatrano (11), Troy Terry (18) |
 |
Goal | 4th Period 3:34 | Troy Terry Goal (13) Wrist Shot, assists: John Gibson (1) |
Statistics
 ANA ANA |
 WPG WPG |
|
|---|---|---|
| 22 | Blocked Shots | 9 |
| 44 | Hits | 26 |
| 4 | Takeaways | 8 |
| 24 | Shots | 30 |
| 0 | Power Play Goals | 0 |
| 0 | Power Play Opportunities | 2 |
| 0.0 | Power Play Percentage | 0.0 |
| 0 | Short Handed Goals | 0 |
| 0 | Shootout Goals | 0 |
| 18 | Faceoffs Won | 32 |
| 36.0 | Faceoff Win Percent | 64.0 |
| 13 | Giveaways | 15 |
| 2 | Total Penalties | 0 |
| 4 | Penalty Minutes | 0 |
Game Information
 Canada Life Centre
Location: Winnipeg, MB
Attendance: 15,225 | Capacity:

Location: Winnipeg, MB
Attendance: 15,225 | Capacity:
2024-25 Pacific Division Standings
| TEAM | W | L | PTS | OTL |
|---|---|---|---|---|
 Vegas Vegas |
38 | 18 | 82 | 6 |
 Edmonton Edmonton |
37 | 22 | 78 | 4 |
 Los Angeles Los Angeles |
32 | 20 | 73 | 9 |
 Calgary Calgary |
30 | 23 | 70 | 10 |
 Vancouver Vancouver |
29 | 22 | 69 | 11 |
 Anaheim Anaheim |
27 | 28 | 61 | 7 |
 Seattle Seattle |
27 | 33 | 58 | 4 |
 San Jose San Jose |
17 | 39 | 43 | 9 |
2024-25 Central Division Standings
| TEAM | W | L | PTS | OTL |
|---|---|---|---|---|
 Winnipeg Winnipeg |
44 | 16 | 92 | 4 |
 Dallas Dallas |
41 | 20 | 84 | 2 |
 Colorado Colorado |
38 | 24 | 78 | 2 |
 Minnesota Minnesota |
36 | 23 | 76 | 4 |
 St. Louis St. Louis |
31 | 27 | 69 | 7 |
 Utah Utah |
28 | 25 | 66 | 10 |
 Nashville Nashville |
24 | 32 | 55 | 7 |
 Chicago Chicago |
20 | 35 | 49 | 9 |

