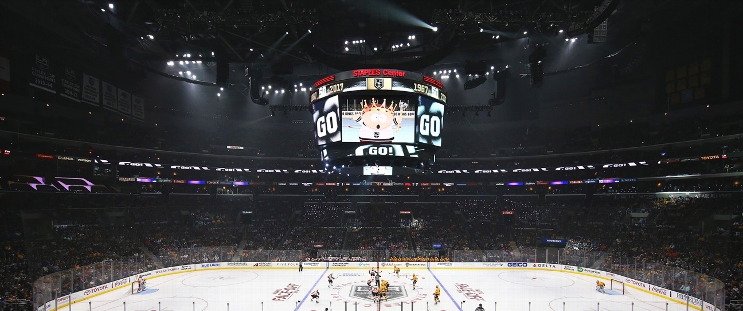
New Jersey Devils at Los Angeles Kings
· National Hockey LeagueAndre Lee scores his 1st NHL goal, and the Kings blank the slumping Devils 3-0

Quinton Byfield also scored for the Kings, and Adrian Kempe added an empty-netter with 4:25 to play. Kuemper made 32 saves for his 33rd career shutout.
Byfield, who has three goals and five points in the past three games, made it 2-0 at 11:01 of the third period. The forward came out of the penalty box and put a wrist shot past Jake Allen.
Lee opened the scoring 6:23 into the second period when he skated under a puck flung high up the ice by Jordan Spence and split two Devils defensemen to beat Allen. Lee, a 24-year-old Swedish forward drafted in the seventh round in 2019, finally scored in his 19th game after making his NHL debut in Los Angeles' season opener Oct. 10.
Allen stopped 21 shots for New Jersey.
Kings: Extended their home winning streak to eight games. Los Angeles is 13-2-1 at Crypto.com Arena this season, with its .844 winning percentage being the highest in the league.
Series tied 1-1
Scoring Summary
 |
Goal | 2nd Period 6:23 | Andre Lee Goal (1) Wrist Shot, assists: Jordan Spence (11), Jacob Moverare (3) |
 |
Goal | 3rd Period 11:01 | Quinton Byfield Goal (9) Wrist Shot, assists: Phillip Danault (17), Mikey Anderson (7) |
 |
Goal | 3rd Period 15:35 | Adrian Kempe Goal (18) Wrist Shot, assists: Warren Foegele (12), Mikey Anderson (8) |
Statistics
 NJ NJ |
 LA LA |
|
|---|---|---|
| 14 | Blocked Shots | 20 |
| 23 | Hits | 15 |
| 3 | Takeaways | 2 |
| 33 | Shots | 24 |
| 0 | Power Play Goals | 0 |
| 6 | Power Play Opportunities | 3 |
| 0.0 | Power Play Percentage | 0.0 |
| 0 | Short Handed Goals | 0 |
| 0 | Shootout Goals | 0 |
| 35 | Faceoffs Won | 21 |
| 62.5 | Faceoff Win Percent | 37.5 |
| 8 | Giveaways | 12 |
| 3 | Total Penalties | 5 |
| 6 | Penalty Minutes | 12 |
Game Information
 crypto.com Arena
Location: Los Angeles, CA
Attendance: 18,145 | Capacity:

Location: Los Angeles, CA
Attendance: 18,145 | Capacity:
2024-25 Metropolitan Division Standings
| TEAM | W | L | PTS | OTL |
|---|---|---|---|---|
 Washington Washington |
36 | 11 | 80 | 8 |
 Carolina Carolina |
33 | 19 | 70 | 4 |
 New Jersey New Jersey |
31 | 20 | 68 | 6 |
 Columbus Columbus |
26 | 22 | 60 | 8 |
 NY Rangers NY Rangers |
27 | 24 | 58 | 4 |
 NY Islanders NY Islanders |
25 | 23 | 57 | 7 |
 Pittsburgh Pittsburgh |
23 | 25 | 55 | 9 |
 Philadelphia Philadelphia |
24 | 26 | 55 | 7 |
2024-25 Pacific Division Standings
| TEAM | W | L | PTS | OTL |
|---|---|---|---|---|
 Edmonton Edmonton |
34 | 17 | 72 | 4 |
 Vegas Vegas |
33 | 17 | 72 | 6 |
 Los Angeles Los Angeles |
29 | 17 | 65 | 7 |
 Vancouver Vancouver |
26 | 18 | 63 | 11 |
 Calgary Calgary |
26 | 21 | 60 | 8 |
 Anaheim Anaheim |
24 | 24 | 54 | 6 |
 Seattle Seattle |
24 | 29 | 52 | 4 |
 San Jose San Jose |
15 | 35 | 37 | 7 |

