
Philadelphia Flyers at San Jose Sharks
· National Hockey LeagueTravis Konecny scores team-leading 17th goal in Flyers' 4-0 shutout over Sharks

Nick Seeler, Ryan Poehling and Egor Zamula also scored for Philadelphia.
Samuel Ersson made 15 saves and combined with Aleksei Kolosov for the shutout. Kolosov replaced an injured Ersson at the start of the third period and had seven saves.
Second-period goals by Poehling and Konecny gave the Flyers a 3-0 lead heading into the third.
The game featured two of the league’s top rookies in the Flyers’ Matvei Michkov, who leads all rookies with 29 points, and the Sharks’ Macklin Celebrini, the first overall pick in this year’s draft who is two points behind Michkov. Celebrini had six shots and an attempt off the post, while Michkov had two shots.
Sharks: The Sharks have lost eight straight and are one away from matching their nine-game losing streak to start the season. Celebrini was not too interested in the matchup with Michkov, saying before the game that he just wants to “stop losing.”
PHI wins series 2-0
Scoring Summary
 |
Goal | 1st Period 5:59 | Nick Seeler Goal (3) Wrist Shot, assists: Jamie Drysdale (5) |
 |
Goal | 2nd Period 12:09 | Ryan Poehling Goal (3) Backhand, assists: Egor Zamula (6), Bobby Brink (13) |
 |
Goal | 2nd Period 13:44 | Travis Konecny Goal (17) Slap Shot, assists: Owen Tippett (12), Jamie Drysdale (6) |
 |
Goal | 3rd Period 2:30 | Egor Zamula Goal (3) Wrist Shot, assists: Bobby Brink (14), Noah Cates (7) |
Statistics
 PHI PHI |
 SJ SJ |
|
|---|---|---|
| 20 | Blocked Shots | 11 |
| 20 | Hits | 41 |
| 6 | Takeaways | 8 |
| 34 | Shots | 22 |
| 1 | Power Play Goals | 0 |
| 3 | Power Play Opportunities | 1 |
| 33.3 | Power Play Percentage | 0.0 |
| 0 | Short Handed Goals | 0 |
| 0 | Shootout Goals | 0 |
| 24 | Faceoffs Won | 28 |
| 46.2 | Faceoff Win Percent | 53.8 |
| 9 | Giveaways | 8 |
| 2 | Total Penalties | 4 |
| 4 | Penalty Minutes | 8 |
 San Jose Sharks Injuries
| NAME, POS | STATUS | DATE |
|---|---|---|
| Ryan Reaves, RW | Injured Reserve | Feb 3 |
| Ty Dellandrea, C | Injured Reserve | Jan 15 |
| Logan Couture, C | Injured Reserve | Sep 30 |
 Philadelphia Flyers Injuries
| NAME, POS | STATUS | DATE |
|---|---|---|
| Samuel Ersson, G | Day-To-Day | Feb 6 |
| Ty Murchison, D | Out | Feb 3 |
| Rodrigo Abols, C | Injured Reserve | Jan 21 |
Game Information
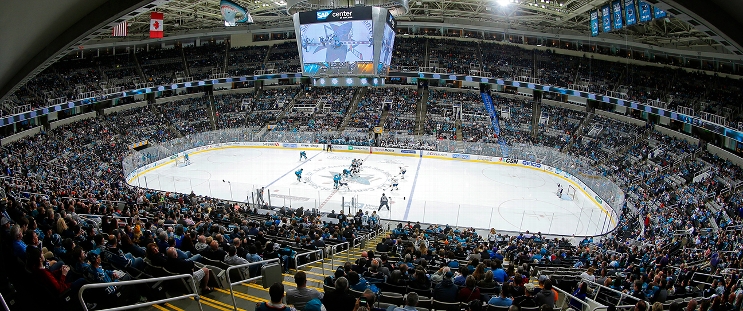 SAP Center at San Jose
Location: San Jose, CA
Attendance: 14,816 | Capacity:

Location: San Jose, CA
Attendance: 14,816 | Capacity:
2025-26 Metropolitan Division Standings
| TEAM | W | L | PTS | OTL |
|---|---|---|---|---|
 Carolina Carolina |
36 | 15 | 78 | 6 |
 Pittsburgh Pittsburgh |
29 | 15 | 70 | 12 |
 NY Islanders NY Islanders |
32 | 21 | 69 | 5 |
 Columbus Columbus |
29 | 20 | 65 | 7 |
 Washington Washington |
29 | 23 | 65 | 7 |
 Philadelphia Philadelphia |
25 | 20 | 61 | 11 |
 New Jersey New Jersey |
28 | 27 | 58 | 2 |
 NY Rangers NY Rangers |
22 | 29 | 50 | 6 |
2025-26 Pacific Division Standings
| TEAM | W | L | PTS | OTL |
|---|---|---|---|---|
 Vegas Vegas |
27 | 16 | 68 | 14 |
 Edmonton Edmonton |
28 | 22 | 64 | 8 |
 Seattle Seattle |
27 | 20 | 63 | 9 |
 Anaheim Anaheim |
30 | 23 | 63 | 3 |
 Los Angeles Los Angeles |
23 | 19 | 60 | 14 |
 San Jose San Jose |
27 | 24 | 58 | 4 |
 Calgary Calgary |
23 | 27 | 52 | 6 |
 Vancouver Vancouver |
18 | 33 | 42 | 6 |

