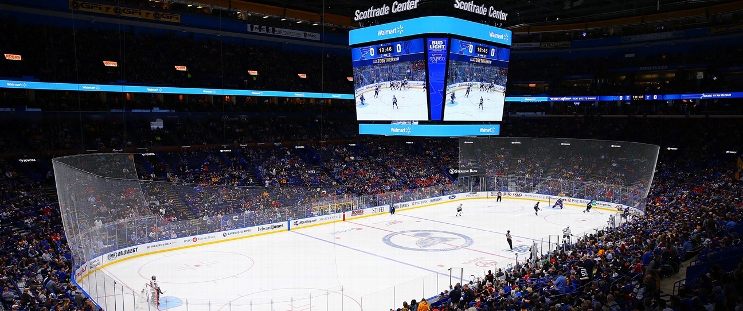
Buffalo Sabres at St. Louis Blues
· National Hockey LeagueSabres get power-play goals from Zucker and Thompson in 4-2 win over the Blues

Jiri Kulich extended Buffalo’s lead with a breakaway goal that went between Blues goalie Jordan Binnington’s legs with 3:41 to play.
Tage Thompson had a goal and an assist against his former team as the Sabres won in St. Louis for just the second time in 12 years to sweep the season series. Zucker had a goal and an assist, and Jack Quinn had two assists for Buffalo. Ukko-Pekka Luukkonen stopped 35 shots.
Brayden Schenn and Nathan Walker scored for the Blues. Binnington had 12 saves.
Buffalo scored on two of its first three shots, including its first of the game.
St. Louis: The Blues, who are tied for an NHL-low five power-play goals at home, went 0 for 4 with the man advantage.
BUF wins series 2-0
Scoring Summary
 |
Goal | 1st Period 6:52 | Peyton Krebs Goal (4) Tip-In, assists: Bowen Byram (16), Rasmus Dahlin (20) |
 |
Goal | 1st Period 13:06 | Tage Thompson Goal (18) Wrist Shot, assists: Jason Zucker (15), Jack Quinn (7) |
 |
Goal | 1st Period 15:47 | Brayden Schenn Goal (6) Wrist Shot, assists: Colton Parayko (14), Jake Neighbours (8) |
 |
Goal | 3rd Period 5:56 | Nathan Walker Goal (4) Wrist Shot, assists: Colton Parayko (15), Alexey Toropchenko (5) |
 |
Goal | 3rd Period 10:30 | Jason Zucker Goal (10) Wrist Shot, assists: Jack Quinn (8), Tage Thompson (11) |
 |
Goal | 3rd Period 16:19 | Jiri Kulich Goal (7) Wrist Shot, assists: Mattias Samuelsson (3) |
Statistics
 BUF BUF |
 STL STL |
|
|---|---|---|
| 23 | Blocked Shots | 4 |
| 20 | Hits | 14 |
| 3 | Takeaways | 6 |
| 16 | Shots | 37 |
| 2 | Power Play Goals | 0 |
| 3 | Power Play Opportunities | 4 |
| 66.7 | Power Play Percentage | 0.0 |
| 0 | Short Handed Goals | 0 |
| 0 | Shootout Goals | 0 |
| 24 | Faceoffs Won | 36 |
| 40.0 | Faceoff Win Percent | 60.0 |
| 11 | Giveaways | 8 |
| 4 | Total Penalties | 3 |
| 8 | Penalty Minutes | 6 |
Game Information
 Enterprise Center
Location: Saint Louis, MO
Attendance: 18,096 | Capacity:

Location: Saint Louis, MO
Attendance: 18,096 | Capacity:
2024-25 Atlantic Division Standings
| TEAM | W | L | PTS | OTL |
|---|---|---|---|---|
 Toronto Toronto |
27 | 13 | 56 | 2 |
 Florida Florida |
24 | 15 | 50 | 2 |
 Boston Boston |
20 | 18 | 45 | 5 |
 Tampa Bay Tampa Bay |
21 | 15 | 44 | 2 |
 Ottawa Ottawa |
19 | 17 | 41 | 3 |
 Montreal Montreal |
19 | 18 | 41 | 3 |
 Detroit Detroit |
18 | 18 | 40 | 4 |
 Buffalo Buffalo |
15 | 21 | 35 | 5 |
2024-25 Central Division Standings
| TEAM | W | L | PTS | OTL |
|---|---|---|---|---|
 Winnipeg Winnipeg |
28 | 12 | 58 | 2 |
 Minnesota Minnesota |
26 | 11 | 56 | 4 |
 Dallas Dallas |
25 | 13 | 51 | 1 |
 Colorado Colorado |
25 | 15 | 51 | 1 |
 St. Louis St. Louis |
19 | 19 | 42 | 4 |
 Utah Utah |
17 | 15 | 41 | 7 |
 Nashville Nashville |
13 | 21 | 33 | 7 |
 Chicago Chicago |
13 | 25 | 28 | 2 |

