Los Angeles Kings at Nashville Predators
· National Hockey LeagueNick Blankenburg scores in overtime as the Predators beat the Kings 3-2

Zachary L’Heureux and Jonathan Marchessault also scored, and Justus Annunen made 22 saves for Nashville, which is 2-0-1 in its last three games.
Quinton Byfield and Alex Laferriere scored, and Darcy Kuemper made 23 saves for the Kings, who are 8-1-2 in their last 11 games.
In overtime, Blankenburg converted the rebound of a shot by Filip Forsberg for his first goal as a member of the Predators.
Annunen, who was acquired from Colorado in a Nov. 30 trade, improved to 2-1-0 in three games with the Predators.
L’Heureux scored the game’s first goal with 5:44 remaining in the first.
Roman Josi drove down the left side and beat Kings defenseman Kyle Burroughs with a toe drag before finding Marchessault in front for his third goal in as many games.
Josi returned to the Nashville lineup after missing the last four games due to a lower-body injury.
Predators: Nashville is 2-7 this season in games that have gone to overtime.
Series tied 1-1
Scoring Summary
 |
Goal | 1st Period 14:16 | Zachary L'Heureux Goal (4) Wrist Shot, assists: Gustav Nyquist (7), Ryan O'Reilly (12) |
 |
Goal | 2nd Period 14:00 | Jonathan Marchessault Goal (10) Wrist Shot, assists: Roman Josi (17), Filip Forsberg (16) |
 |
Goal | 3rd Period 9:24 | Quinton Byfield Goal (6) Wrist Shot, assists: Warren Foegele (9), Vladislav Gavrikov (14) |
 |
Goal | 3rd Period 13:23 | Alex Laferriere Goal (13) Wrist Shot, assists: Phillip Danault (14), Joel Edmundson (6) |
 |
Goal | 4th Period 1:03 | Nick Blankenburg Goal (1) Backhand, assists: Filip Forsberg (17) |
Statistics
 LA LA |
 NSH NSH |
|
|---|---|---|
| 9 | Blocked Shots | 9 |
| 12 | Hits | 24 |
| 1 | Takeaways | 2 |
| 24 | Shots | 26 |
| 0 | Power Play Goals | 0 |
| 1 | Power Play Opportunities | 2 |
| 0.0 | Power Play Percentage | 0.0 |
| 0 | Short Handed Goals | 0 |
| 0 | Shootout Goals | 0 |
| 22 | Faceoffs Won | 24 |
| 47.8 | Faceoff Win Percent | 52.2 |
| 13 | Giveaways | 12 |
| 2 | Total Penalties | 1 |
| 4 | Penalty Minutes | 2 |
Game Information
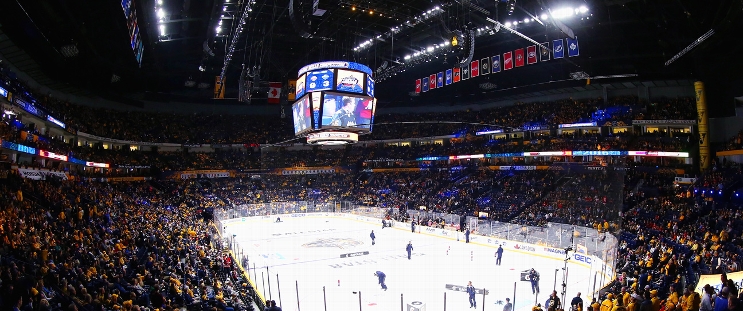 Bridgestone Arena
Location: Nashville, TN
Attendance: 17,159 | Capacity:

Location: Nashville, TN
Attendance: 17,159 | Capacity:
2024-25 Pacific Division Standings
| TEAM | W | L | PTS | OTL |
|---|---|---|---|---|
 Edmonton Edmonton |
34 | 17 | 72 | 4 |
 Vegas Vegas |
33 | 17 | 72 | 6 |
 Los Angeles Los Angeles |
29 | 17 | 65 | 7 |
 Vancouver Vancouver |
26 | 18 | 63 | 11 |
 Calgary Calgary |
26 | 21 | 60 | 8 |
 Anaheim Anaheim |
24 | 24 | 54 | 6 |
 Seattle Seattle |
24 | 29 | 52 | 4 |
 San Jose San Jose |
15 | 35 | 37 | 7 |
2024-25 Central Division Standings
| TEAM | W | L | PTS | OTL |
|---|---|---|---|---|
 Winnipeg Winnipeg |
39 | 14 | 81 | 3 |
 Dallas Dallas |
35 | 18 | 72 | 2 |
 Minnesota Minnesota |
33 | 19 | 70 | 4 |
 Colorado Colorado |
33 | 22 | 68 | 2 |
 Utah Utah |
24 | 23 | 57 | 9 |
 St. Louis St. Louis |
25 | 26 | 55 | 5 |
 Nashville Nashville |
19 | 28 | 45 | 7 |
 Chicago Chicago |
17 | 31 | 41 | 7 |
