Colorado Avalanche at San Jose Sharks
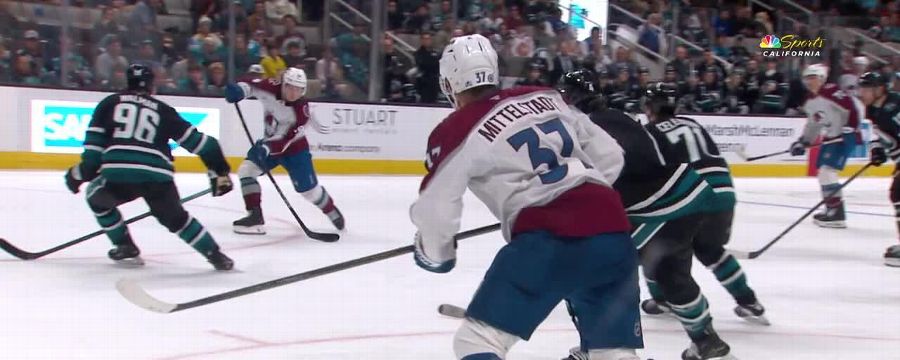
· National Hockey LeagueKiviranta scores twice in 3rd, Blackwood gets win over former team as Avalanche beat Sharks 4-2

The Avalanche have won five of seven, while the Sharks have dropped six of seven.
After the Avalanche killed a penalty, Kiviranta scored off the counterattack at 13:06 of the third to give Colorado a 3-2 lead. He scored again just under three minutes later for an insurance goal.
The game featured goaltenders who were traded for each other last week. Alexandar Georgiev stopped 27 shots for the Sharks.
Valeri Nichushkin opened the scoring for Colorado in the first period. In the second, Carl Grundstrom scored his first goal with San Jose, and William Eklund gave the Sharks the lead.
Luke Kunin assisted on both Sharks goals. Nathan MacKinnon and Cale Makar each had two assists for the Avalanche.
Trailing 2-1 entering the third, Colorado tied the game on a power-play goal by Mikko Rantanen midway through the period.
Sharks: San Jose has given up multiple third-period goals in each of its last five games. Head coach Ryan Warsofsky said before the game his team had felt frustrated at not being able to close out opponents.
COL leads series 2-0
Scoring Summary
 |
Goal | 1st Period 3:40 | Valeri Nichushkin Goal (9) Backhand, assists: Cale Makar (30), Nathan MacKinnon (38) |
 |
Goal | 2nd Period 4:26 | Carl Grundstrom Goal (1) Wrist Shot, assists: Jan Rutta (4), Luke Kunin (5) |
 |
Goal | 2nd Period 9:29 | William Eklund Goal (6) Wrist Shot, assists: Cody Ceci (8), Luke Kunin (6) |
 |
Goal | 3rd Period 8:26 | Mikko Rantanen Goal (19) Slap Shot, assists: Nathan MacKinnon (39), Cale Makar (31) |
 |
Goal | 3rd Period 13:06 | Joel Kiviranta Goal (6) Wrist Shot, assists: Logan O'Connor (4) |
 |
Goal | 3rd Period 15:58 | Joel Kiviranta Goal (7) Slap Shot, assists: Artturi Lehkonen (6), Casey Mittelstadt (16) |
Statistics
 COL COL |
 SJ SJ |
|
|---|---|---|
| 13 | Blocked Shots | 16 |
| 10 | Hits | 11 |
| 3 | Takeaways | 5 |
| 31 | Shots | 34 |
| 2 | Power Play Goals | 0 |
| 4 | Power Play Opportunities | 4 |
| 50.0 | Power Play Percentage | 0.0 |
| 0 | Short Handed Goals | 0 |
| 0 | Shootout Goals | 0 |
| 34 | Faceoffs Won | 32 |
| 51.5 | Faceoff Win Percent | 48.5 |
| 9 | Giveaways | 10 |
| 5 | Total Penalties | 5 |
| 10 | Penalty Minutes | 10 |
 San Jose Sharks Injuries
| NAME, POS | STATUS | DATE |
|---|---|---|
| Ryan Reaves, RW | Injured Reserve | Feb 3 |
| Ty Dellandrea, C | Injured Reserve | Jan 15 |
| Logan Couture, C | Injured Reserve | Sep 30 |
 Colorado Avalanche Injuries
| NAME, POS | STATUS | DATE |
|---|
Game Information
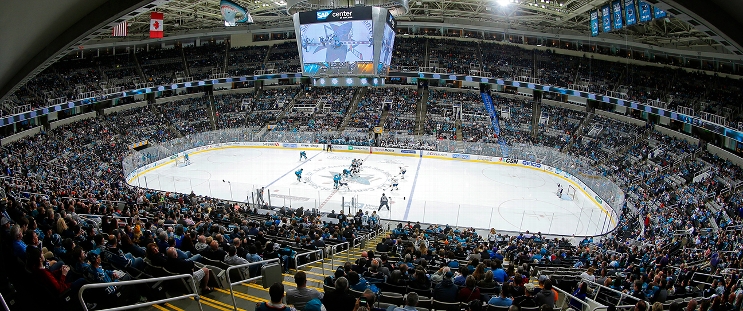
 SAP Center at San Jose
Location: San Jose, CA
Attendance: 12,517 | Capacity:

Location: San Jose, CA
Attendance: 12,517 | Capacity:
2025-26 Central Division Standings
| TEAM | W | L | PTS | OTL |
|---|---|---|---|---|
 Colorado Colorado |
37 | 9 | 83 | 9 |
 Minnesota Minnesota |
34 | 14 | 78 | 10 |
 Dallas Dallas |
34 | 14 | 77 | 9 |
 Utah Utah |
30 | 23 | 64 | 4 |
 Nashville Nashville |
26 | 24 | 59 | 7 |
 Chicago Chicago |
22 | 26 | 53 | 9 |
 Winnipeg Winnipeg |
22 | 26 | 52 | 8 |
 St. Louis St. Louis |
20 | 28 | 49 | 9 |
2025-26 Pacific Division Standings
| TEAM | W | L | PTS | OTL |
|---|---|---|---|---|
 Vegas Vegas |
27 | 16 | 68 | 14 |
 Edmonton Edmonton |
28 | 22 | 64 | 8 |
 Seattle Seattle |
27 | 20 | 63 | 9 |
 Anaheim Anaheim |
30 | 23 | 63 | 3 |
 Los Angeles Los Angeles |
23 | 19 | 60 | 14 |
 San Jose San Jose |
27 | 24 | 58 | 4 |
 Calgary Calgary |
23 | 27 | 52 | 6 |
 Vancouver Vancouver |
18 | 33 | 42 | 6 |

