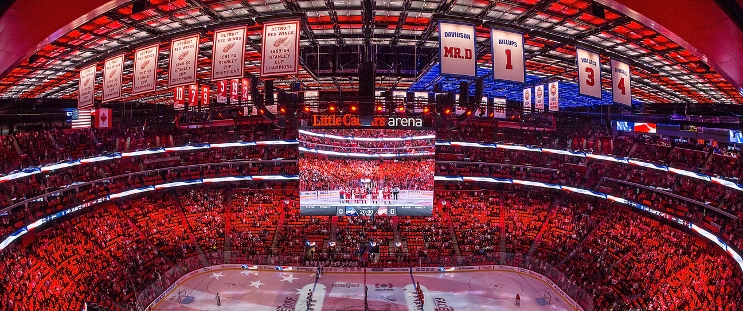
Philadelphia Flyers at Detroit Red Wings
· National Hockey League
Regular Season Series
Series tied 1-1
Scoring Summary
 |
Goal | 1st Period 1:06 | Travis Konecny Goal (16) Backhand, assists: Joel Farabee (8), Sean Couturier (10) |
 |
Goal | 1st Period 18:19 | J.T. Compher Goal (4) Tip-In, assists: Dylan Larkin (13), Lucas Raymond (20) |
 |
Goal | 2nd Period 10:15 | Alex DeBrincat Goal (13) Snap Shot, assists: Patrick Kane (9) |
 |
Goal | 2nd Period 10:40 | Noah Cates Goal (3) Wrist Shot, assists: Tyson Foerster (5), Nick Seeler (9) |
 |
Goal | 2nd Period 16:05 | Michael Rasmussen Goal (6) Wrist Shot, assists: J.T. Compher (12) |
 |
Goal | 2nd Period 17:27 | Joe Veleno Goal (2) Snap Shot, assists: Christian Fischer (3) |
 |
Goal | 3rd Period 3:50 | Ryan Poehling Goal (2) Tip-In, assists: Sean Couturier (11), Travis Sanheim (14) |
 |
Goal | 3rd Period 5:39 | Owen Tippett Goal (10) Wrist Shot, assists: Scott Laughton (8), Jamie Drysdale (4) |
 |
Goal | 3rd Period 7:22 | Patrick Kane Goal (4) Wrist Shot, assists: Moritz Seider (13) |
 |
Goal | 3rd Period 18:48 | Lucas Raymond Goal (13) Wrist Shot, assists: Dylan Larkin (14) |
Statistics
 PHI PHI |
 DET DET |
|
|---|---|---|
| 19 | Blocked Shots | 11 |
| 18 | Hits | 15 |
| 5 | Takeaways | 4 |
| 19 | Shots | 24 |
| 0 | Power Play Goals | 1 |
| 1 | Power Play Opportunities | 3 |
| 0.0 | Power Play Percentage | 33.3 |
| 0 | Short Handed Goals | 0 |
| 0 | Shootout Goals | 0 |
| 27 | Faceoffs Won | 20 |
| 57.4 | Faceoff Win Percent | 42.6 |
| 17 | Giveaways | 11 |
| 2 | Total Penalties | 1 |
| 6 | Penalty Minutes | 2 |
Game Information
 Little Caesars Arena
Location: Detroit, MI
Attendance: 19,515 | Capacity:

Little Caesars Arena
Location: Detroit, MI
Attendance: 19,515 | Capacity:
2024-25 Metropolitan Division Standings
| TEAM | W | L | PTS | OTL |
|---|---|---|---|---|
 Washington Washington |
26 | 10 | 56 | 4 |
 New Jersey New Jersey |
25 | 15 | 53 | 3 |
 Carolina Carolina |
24 | 15 | 50 | 2 |
 Columbus Columbus |
18 | 17 | 42 | 6 |
 Pittsburgh Pittsburgh |
17 | 17 | 42 | 8 |
 Philadelphia Philadelphia |
17 | 19 | 39 | 5 |
 NY Rangers NY Rangers |
18 | 20 | 38 | 2 |
 NY Islanders NY Islanders |
15 | 18 | 37 | 7 |
2024-25 Atlantic Division Standings
| TEAM | W | L | PTS | OTL |
|---|---|---|---|---|
 Toronto Toronto |
27 | 13 | 56 | 2 |
 Florida Florida |
24 | 15 | 50 | 2 |
 Boston Boston |
20 | 18 | 45 | 5 |
 Tampa Bay Tampa Bay |
21 | 15 | 44 | 2 |
 Ottawa Ottawa |
19 | 17 | 41 | 3 |
 Montreal Montreal |
19 | 18 | 41 | 3 |
 Detroit Detroit |
18 | 18 | 40 | 4 |
 Buffalo Buffalo |
15 | 21 | 35 | 5 |

