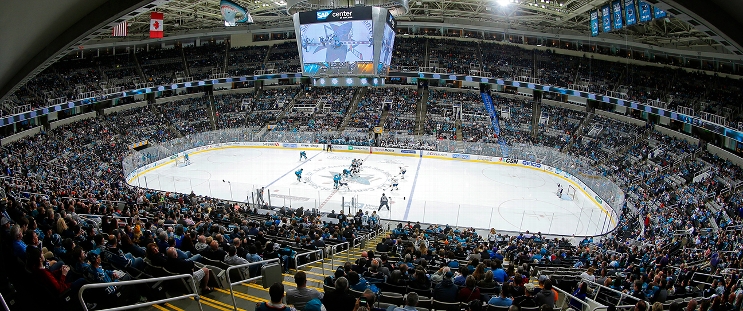
Winnipeg Jets at San Jose Sharks
· National Hockey LeagueLowry scores late goal to help Winnipeg Jets top San Jose Sharks 4-3

Gabriel Vilardi, with three assists, and Mark Scheifele, with a goal and two assists, each added three points for the NHL’s top team.
Tyler Toffoli had a goal and an assist for San Jose, and Fabian Zetterlund and Macklin Celebrini each added a goal.
Lowry scored his ninth goal at 18:47 of the third period off assists from Dylan DeMelo and Mason Appleton.
The Jets trailed 3-2 midway through the third when Connor scored his 19th goal on a power play.
Jets goalie Connor Hellebuyck had 32 saves and Alexandar Georgiev turned back 29 shots for San Jose.
San Jose lost for the fifth time in six games, but the Sharks played inspired hockey against an elite team after coming out flat in the first period.
WPG leads series 2-0
Scoring Summary
 |
Goal | 1st Period 12:18 | Kyle Connor Goal (18) Wrist Shot, assists: Mark Scheifele (19), Gabriel Vilardi (12) |
 |
Goal | 2nd Period 1:52 | Tyler Toffoli Goal (13) Wrist Shot, assists: Nikolai Kovalenko (9), Macklin Celebrini (11) |
 |
Goal | 2nd Period 7:28 | Mark Scheifele Goal (17) Snap Shot, assists: Cole Perfetti (14), Gabriel Vilardi (13) |
 |
Goal | 2nd Period 17:11 | Macklin Celebrini Goal (11) Backhand, assists: Jake Walman (18), Tyler Toffoli (9) |
 |
Goal | 3rd Period 4:44 | Fabian Zetterlund Goal (11) Wrist Shot, assists: Jake Walman (19) |
 |
Goal | 3rd Period 11:56 | Kyle Connor Goal (19) Wrist Shot, assists: Gabriel Vilardi (14), Mark Scheifele (20) |
 |
Goal | 3rd Period 18:47 | Adam Lowry Goal (9) Tip-In, assists: Dylan DeMelo (6), Mason Appleton (9) |
Statistics
 WPG WPG |
 SJ SJ |
|
|---|---|---|
| 13 | Blocked Shots | 13 |
| 17 | Hits | 18 |
| 8 | Takeaways | 3 |
| 33 | Shots | 35 |
| 2 | Power Play Goals | 1 |
| 2 | Power Play Opportunities | 3 |
| 100.0 | Power Play Percentage | 33.3 |
| 0 | Short Handed Goals | 0 |
| 0 | Shootout Goals | 0 |
| 30 | Faceoffs Won | 20 |
| 60.0 | Faceoff Win Percent | 40.0 |
| 9 | Giveaways | 12 |
| 3 | Total Penalties | 2 |
| 6 | Penalty Minutes | 4 |
Game Information
 SAP Center at San Jose
Location: San Jose, CA
Attendance: 10,958 | Capacity:

Location: San Jose, CA
Attendance: 10,958 | Capacity:
2024-25 Central Division Standings
| TEAM | W | L | PTS | OTL |
|---|---|---|---|---|
 Winnipeg Winnipeg |
27 | 12 | 56 | 2 |
 Minnesota Minnesota |
25 | 11 | 54 | 4 |
 Dallas Dallas |
24 | 13 | 49 | 1 |
 Colorado Colorado |
24 | 15 | 49 | 1 |
 St. Louis St. Louis |
19 | 18 | 42 | 4 |
 Utah Utah |
17 | 15 | 41 | 7 |
 Nashville Nashville |
13 | 20 | 33 | 7 |
 Chicago Chicago |
13 | 25 | 28 | 2 |
2024-25 Pacific Division Standings
| TEAM | W | L | PTS | OTL |
|---|---|---|---|---|
 Vegas Vegas |
27 | 9 | 57 | 3 |
 Los Angeles Los Angeles |
23 | 10 | 51 | 5 |
 Edmonton Edmonton |
24 | 12 | 51 | 3 |
 Vancouver Vancouver |
18 | 12 | 44 | 8 |
 Calgary Calgary |
18 | 14 | 43 | 7 |
 Anaheim Anaheim |
17 | 18 | 38 | 4 |
 Seattle Seattle |
17 | 20 | 37 | 3 |
 San Jose San Jose |
13 | 23 | 32 | 6 |

