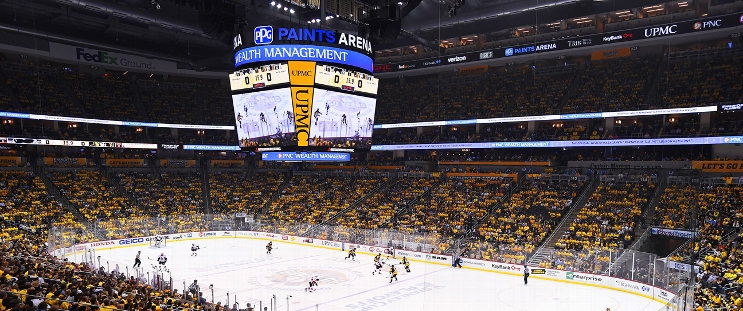
Los Angeles Kings at Pittsburgh Penguins
· National Hockey LeagueRickard Rakell's OT goal pushes Penguins past Kings 3-2

Rakell deflected Erik Karlsson’s point shot behind Darcy Kuemper for the game-winner.
Evgeni Malkin scored, while Matt Grzelcyk forced overtime with 5:35 left in the third period with his first goal as a Penguin. Michael Bunting had two assists in his 300th NHL game.
Alex Nedeljkovic made 29 saves.
Adrian Kempe scored 33 seconds into the game for Los Angeles, and Alex Turcotte also scored. Vladislav Gavrikov added two assists.
Kuemper stopped 28 shots.
Penguins: Pittsburgh has won seven of their last 10. Pittsburgh lost eight of 10 before its current 10-game run.
PIT leads series 1-0
Scoring Summary
 |
Goal | 1st Period 0:33 | Adrian Kempe Goal (16) Wrist Shot, assists: Anze Kopitar (27), Vladislav Gavrikov (10) |
 |
Goal | 2nd Period 6:22 | Evgeni Malkin Goal (7) Backhand, assists: Michael Bunting (8), Bryan Rust (9) |
 |
Goal | 2nd Period 11:38 | Alex Turcotte Goal (4) Wrist Shot, assists: Vladislav Gavrikov (11), Jordan Spence (6) |
 |
Goal | 3rd Period 14:25 | Matt Grzelcyk Goal (1) Wrist Shot, assists: Sidney Crosby (23), Rickard Rakell (10) |
 |
Goal | 4th Period 1:44 | Rickard Rakell Goal (14) Tip-In, assists: Erik Karlsson (18), Michael Bunting (9) |
Statistics
 LA LA |
 PIT PIT |
|
|---|---|---|
| 14 | Blocked Shots | 17 |
| 15 | Hits | 18 |
| 3 | Takeaways | 6 |
| 31 | Shots | 31 |
| 0 | Power Play Goals | 0 |
| 3 | Power Play Opportunities | 3 |
| 0.0 | Power Play Percentage | 0.0 |
| 0 | Short Handed Goals | 0 |
| 0 | Shootout Goals | 0 |
| 32 | Faceoffs Won | 27 |
| 54.2 | Faceoff Win Percent | 45.8 |
| 11 | Giveaways | 13 |
| 3 | Total Penalties | 3 |
| 6 | Penalty Minutes | 6 |
Game Information
 PPG Paints Arena
Location: Pittsburgh, PA
Attendance: 15,011 | Capacity:

Location: Pittsburgh, PA
Attendance: 15,011 | Capacity:
2024-25 Pacific Division Standings
| TEAM | W | L | PTS | OTL |
|---|---|---|---|---|
 Edmonton Edmonton |
34 | 17 | 72 | 4 |
 Vegas Vegas |
33 | 17 | 72 | 6 |
 Los Angeles Los Angeles |
29 | 17 | 65 | 7 |
 Vancouver Vancouver |
26 | 18 | 63 | 11 |
 Calgary Calgary |
26 | 21 | 60 | 8 |
 Anaheim Anaheim |
24 | 24 | 54 | 6 |
 Seattle Seattle |
24 | 29 | 52 | 4 |
 San Jose San Jose |
15 | 35 | 37 | 7 |
2024-25 Metropolitan Division Standings
| TEAM | W | L | PTS | OTL |
|---|---|---|---|---|
 Washington Washington |
36 | 11 | 80 | 8 |
 Carolina Carolina |
33 | 19 | 70 | 4 |
 New Jersey New Jersey |
31 | 20 | 68 | 6 |
 Columbus Columbus |
26 | 22 | 60 | 8 |
 NY Rangers NY Rangers |
27 | 24 | 58 | 4 |
 NY Islanders NY Islanders |
25 | 23 | 57 | 7 |
 Pittsburgh Pittsburgh |
23 | 25 | 55 | 9 |
 Philadelphia Philadelphia |
24 | 26 | 55 | 7 |

