Utah Hockey Club at San Jose Sharks
· National Hockey LeagueKeller scores power-play goal in the final minute to lift Utah past the Sharks, 4-3

Michael Carcone tied it midway through the third and then Utah won it during 4-on-3 play shortly after Cody Ceci was called for high-sticking.
Utah won the faceoff and Keller got the puck in the slot and beat Vitek Vanecek for his 10th goal of the season.
Dylan Guenther and Nick Schmaltz also scored for Utah. Karel Vejmelka made 19 saves.
Fabian Zetterlund gave San Jose a 3-2 lead early in the third period on the power play but the Sharks couldn't close it out. Alexander Wennberg and Mikael Granlund also scored for San Jose. Vanecek made 36 saves.
Sharks: San Jose returned home following a 3-3 road trip and had a lead early in the third period but couldn't close it out. The Sharks have lost four of five games.
Series tied 1-1
Scoring Summary
 |
Goal | 1st Period 7:27 | Dylan Guenther Goal (13) Wrist Shot, assists: Logan Cooley (18), Mikhail Sergachev (14) |
 |
Goal | 1st Period 14:58 | Alexander Wennberg Goal (8) Wrist Shot, assists: Barclay Goodrow (1), Cody Ceci (7) |
 |
Goal | 2nd Period 14:11 | Mikael Granlund Goal (11) Wrist Shot, assists: Fabian Zetterlund (12), William Eklund (20) |
 |
Goal | 2nd Period 18:52 | Nick Schmaltz Goal (5) Slap Shot, assists: Logan Cooley (19), Clayton Keller (18) |
 |
Goal | 3rd Period 5:00 | Fabian Zetterlund Goal (10) Wrist Shot, assists: Nikolai Kovalenko (8), Macklin Celebrini (10) |
 |
Goal | 3rd Period 9:49 | Michael Carcone Goal (3) Wrist Shot, assists: Kevin Stenlund (4), Alexander Kerfoot (7) |
 |
Goal | 3rd Period 19:16 | Clayton Keller Goal (10) Wrist Shot, assists: Mikhail Sergachev (15), Nick Schmaltz (19) |
Statistics
 UTAH UTAH |
 SJ SJ |
|
|---|---|---|
| 12 | Blocked Shots | 18 |
| 17 | Hits | 15 |
| 3 | Takeaways | 4 |
| 40 | Shots | 22 |
| 2 | Power Play Goals | 1 |
| 6 | Power Play Opportunities | 3 |
| 33.3 | Power Play Percentage | 33.3 |
| 0 | Short Handed Goals | 0 |
| 0 | Shootout Goals | 0 |
| 32 | Faceoffs Won | 30 |
| 51.6 | Faceoff Win Percent | 48.4 |
| 14 | Giveaways | 13 |
| 5 | Total Penalties | 8 |
| 10 | Penalty Minutes | 16 |
 San Jose Sharks Injuries
| NAME, POS | STATUS | DATE |
|---|---|---|
| Kiefer Sherwood, LW | Injured Reserve | Jan 29 |
| Ty Dellandrea, C | Injured Reserve | Jan 15 |
| Logan Couture, C | Injured Reserve | Sep 30 |
 Utah Hockey Club Injuries
| NAME, POS | STATUS | DATE |
|---|---|---|
| Alexander Kerfoot, C | Injured Reserve | Feb 2 |
| Logan Cooley, C | Injured Reserve | Feb 2 |
Game Information
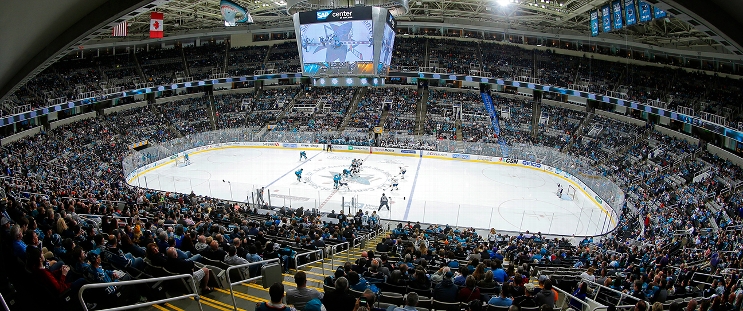
 SAP Center at San Jose
Location: San Jose, CA
Attendance: 17,213 | Capacity:

Location: San Jose, CA
Attendance: 17,213 | Capacity:
2025-26 Central Division Standings
| TEAM | W | L | PTS | OTL |
|---|---|---|---|---|
 Colorado Colorado |
36 | 9 | 81 | 9 |
 Minnesota Minnesota |
33 | 14 | 76 | 10 |
 Dallas Dallas |
33 | 14 | 75 | 9 |
 Utah Utah |
29 | 23 | 62 | 4 |
 Nashville Nashville |
26 | 23 | 58 | 6 |
 Chicago Chicago |
22 | 25 | 53 | 9 |
 Winnipeg Winnipeg |
22 | 25 | 52 | 8 |
 St. Louis St. Louis |
20 | 27 | 49 | 9 |
2025-26 Pacific Division Standings
| TEAM | W | L | PTS | OTL |
|---|---|---|---|---|
 Vegas Vegas |
25 | 16 | 64 | 14 |
 Edmonton Edmonton |
28 | 20 | 64 | 8 |
 Seattle Seattle |
26 | 19 | 61 | 9 |
 Anaheim Anaheim |
29 | 23 | 61 | 3 |
 Los Angeles Los Angeles |
23 | 17 | 60 | 14 |
 San Jose San Jose |
27 | 23 | 58 | 4 |
 Calgary Calgary |
22 | 27 | 50 | 6 |
 Vancouver Vancouver |
18 | 32 | 42 | 6 |

