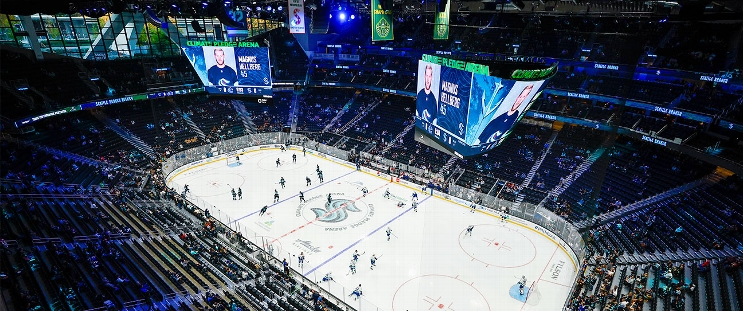
Boston Bruins at Seattle Kraken
· National Hockey LeagueBjorkstrand scores twice for Kraken in 5-1 win over Bruins

Jaden Schwartz and Vince Dunn also scored for the Kraken. Jared McCann had an empty-net goal and an assist, and Shane Wright added two assists.
Brad Marchand scored on a penalty shot for Boston in the second period.
Seattle jumped to a 2-0 lead early in the first. Bjorkstrand scored on a power play 24 seconds into the game, just eight seconds after David Pastrnak took a double minor for high-sticking. Schwartz backhanded the puck over goalie Joonas Korpisalo about five minutes later.
Dunn batted the puck into Boston’s net early in the third period and the goal stood after a replay review. Seattle made it 4-1 when Wright set up Bjorkstrand for his 11th goal at 9:16.
Bjorkstrand has 14 points in his last 11 games.
Bruins: Have allowed 13 goals in the first two games of their road trip.
Series tied 1-1
Scoring Summary
 |
Goal | 1st Period 0:24 | Oliver Bjorkstrand Goal (10) Tip-In, assists: Matty Beniers (13), Chandler Stephenson (18) |
 |
Goal | 1st Period 5:14 | Jaden Schwartz Goal (8) Backhand, assists: Shane Wright (5) |
 |
Goal | 2nd Period 10:28 | Brad Marchand Goal (12) Backhand, assists: none |
 |
Goal | 3rd Period 3:07 | Vince Dunn Goal (4) Batted, assists: Jared McCann (15), Andre Burakovsky (10) |
 |
Goal | 3rd Period 9:16 | Oliver Bjorkstrand Goal (11) Wrist Shot, assists: Shane Wright (6), Eeli Tolvanen (6) |
 |
Goal | 3rd Period 18:06 | Jared McCann Goal (11) Wrist Shot, assists: Brandon Tanev (7) |
Statistics
 BOS BOS |
 SEA SEA |
|
|---|---|---|
| 19 | Blocked Shots | 20 |
| 23 | Hits | 26 |
| 5 | Takeaways | 5 |
| 34 | Shots | 21 |
| 0 | Power Play Goals | 1 |
| 1 | Power Play Opportunities | 3 |
| 0.0 | Power Play Percentage | 33.3 |
| 0 | Short Handed Goals | 0 |
| 0 | Shootout Goals | 0 |
| 25 | Faceoffs Won | 19 |
| 56.8 | Faceoff Win Percent | 43.2 |
| 14 | Giveaways | 19 |
| 2 | Total Penalties | 1 |
| 6 | Penalty Minutes | 2 |
Game Information
 Climate Pledge Arena
Location: Seattle, WA
Attendance: 17,151 | Capacity:

Location: Seattle, WA
Attendance: 17,151 | Capacity:
2024-25 Atlantic Division Standings
| TEAM | W | L | PTS | OTL |
|---|---|---|---|---|
 Toronto Toronto |
27 | 13 | 56 | 2 |
 Florida Florida |
25 | 15 | 52 | 2 |
 Boston Boston |
20 | 18 | 45 | 5 |
 Tampa Bay Tampa Bay |
21 | 15 | 44 | 2 |
 Ottawa Ottawa |
19 | 17 | 41 | 3 |
 Montreal Montreal |
19 | 18 | 41 | 3 |
 Detroit Detroit |
18 | 18 | 40 | 4 |
 Buffalo Buffalo |
15 | 21 | 35 | 5 |
2024-25 Pacific Division Standings
| TEAM | W | L | PTS | OTL |
|---|---|---|---|---|
 Vegas Vegas |
28 | 9 | 59 | 3 |
 Edmonton Edmonton |
25 | 12 | 53 | 3 |
 Los Angeles Los Angeles |
23 | 10 | 51 | 5 |
 Vancouver Vancouver |
18 | 12 | 46 | 10 |
 Calgary Calgary |
19 | 14 | 45 | 7 |
 Anaheim Anaheim |
17 | 18 | 39 | 5 |
 Seattle Seattle |
17 | 21 | 37 | 3 |
 San Jose San Jose |
13 | 24 | 32 | 6 |

