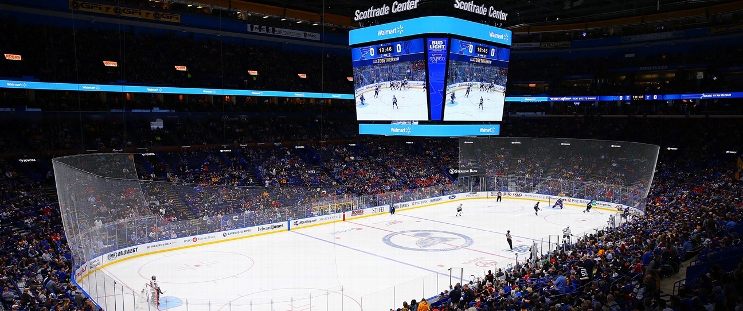
San Jose Sharks at St. Louis Blues
· National Hockey LeagueMacklin Celebrini scores twice in Sharks' 4-3 victory over the Blues

Tyler Toffoli and Jake Walman also scored, and Alexandar Georgiev made 17 saves to help the Sharks snap a three-game losing streak in the final game of a six-game, 13-day trip.
Jake Neighbours, Brayden Schenn and Jordan Kyrou scored for St. Louis, and Jordan Binnington made 27 saves. The Blues are 5-2-1 since Jim Montgomery took over as coach.
Kyrou scored his team-leading 11th goal of the season 7:57 into the third period to cut the Sharks’ lead to 4-3
Schenn scored 5:34 into the third period, but Walman replied 27 seconds later to restore San Jose’s two goal lead.
Celebrini, the first overall pick in the June draft, scored his 10th goal of the season and second of the game on a power play with seven seconds remaining in the second period to extend San Jose’s lead to 3-1. He put the Sharks ahead with a goal earlier in the period.
Blues: Still showed the effects of a recently completed four-game as they struggled to generate offensive zone time.
STL wins series 2-1
Scoring Summary
 |
Goal | 1st Period 1:21 | Tyler Toffoli Goal (12) Wrist Shot, assists: Macklin Celebrini (9), Nikolai Kovalenko (5) |
 |
Goal | 1st Period 10:26 | Jake Neighbours Goal (10) Wrist Shot, assists: Ryan Suter (6), Colton Parayko (11) |
 |
Goal | 2nd Period 5:43 | Macklin Celebrini Goal (9) Wrist Shot, assists: Timothy Liljegren (3), Nikolai Kovalenko (6) |
 |
Goal | 2nd Period 19:53 | Macklin Celebrini Goal (10) Wrist Shot, assists: Mikael Granlund (21), Jake Walman (17) |
 |
Goal | 3rd Period 5:34 | Brayden Schenn Goal (5) Snap Shot, assists: Zack Bolduc (6), Jake Neighbours (6) |
 |
Goal | 3rd Period 6:01 | Jake Walman Goal (5) Snap Shot, assists: Nikolai Kovalenko (7), Nico Sturm (5) |
 |
Goal | 3rd Period 7:57 | Jordan Kyrou Goal (11) Wrist Shot, assists: Pavel Buchnevich (12), Robert Thomas (15) |
Statistics
 SJ SJ |
 STL STL |
|
|---|---|---|
| 21 | Blocked Shots | 14 |
| 32 | Hits | 31 |
| 12 | Takeaways | 2 |
| 31 | Shots | 20 |
| 1 | Power Play Goals | 0 |
| 2 | Power Play Opportunities | 2 |
| 50.0 | Power Play Percentage | 0.0 |
| 0 | Short Handed Goals | 0 |
| 0 | Shootout Goals | 0 |
| 19 | Faceoffs Won | 19 |
| 50.0 | Faceoff Win Percent | 50.0 |
| 15 | Giveaways | 16 |
| 4 | Total Penalties | 4 |
| 11 | Penalty Minutes | 11 |
Game Information
 Enterprise Center
Location: Saint Louis, MO
Attendance: 18,096 | Capacity:

Location: Saint Louis, MO
Attendance: 18,096 | Capacity:
2024-25 Pacific Division Standings
| TEAM | W | L | PTS | OTL |
|---|---|---|---|---|
 Vegas Vegas |
28 | 9 | 59 | 3 |
 Edmonton Edmonton |
25 | 12 | 53 | 3 |
 Los Angeles Los Angeles |
23 | 10 | 51 | 5 |
 Vancouver Vancouver |
18 | 12 | 45 | 9 |
 Calgary Calgary |
19 | 14 | 45 | 7 |
 Anaheim Anaheim |
17 | 18 | 39 | 5 |
 Seattle Seattle |
17 | 21 | 37 | 3 |
 San Jose San Jose |
13 | 24 | 32 | 6 |
2024-25 Central Division Standings
| TEAM | W | L | PTS | OTL |
|---|---|---|---|---|
 Winnipeg Winnipeg |
28 | 12 | 58 | 2 |
 Minnesota Minnesota |
26 | 11 | 56 | 4 |
 Dallas Dallas |
25 | 13 | 51 | 1 |
 Colorado Colorado |
25 | 15 | 51 | 1 |
 St. Louis St. Louis |
19 | 19 | 42 | 4 |
 Utah Utah |
17 | 15 | 41 | 7 |
 Nashville Nashville |
13 | 21 | 33 | 7 |
 Chicago Chicago |
13 | 25 | 28 | 2 |

