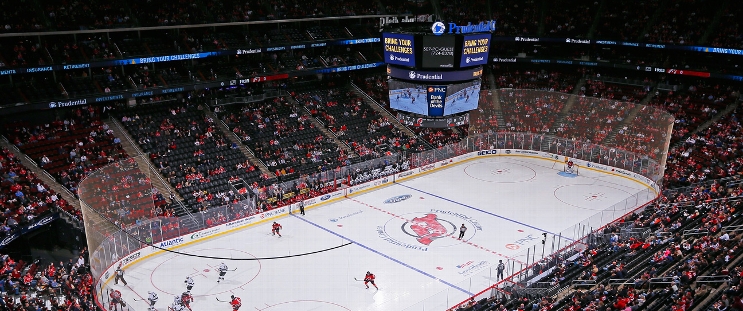
Los Angeles Kings at New Jersey Devils
· National Hockey LeagueJack Hughes scores go-ahead goal, has 2 assists as Devils beat Kings 3-1

Hughes snapped his 12th goal of the season past Kings goaltender David Rittich with 7:02 left in the third period to give the Devils their first lead. Ondrej Palat and Brett Pesce also scored for New Jersey, which won for the first time in three games.
Kings defenseman Jordan Spence opened the scoring when he fired a one-timer past Jacob Markstrom with 3:19 left in the second. The goal was assisted by New Jersey native Alex Laferriere and Phillip Danault.
Palat answered — assisted by Hughes and Jesper Bratt — with 1:04 left in the second.
Pesce’s goal, which was short-handed, was his first as a Devil and came with 2:43 left to cement the win as Markstrom improved to 14-6-2 this season.
Markstrom stopped 12 shots for New Jersey, and Rittich made 23 saves for the Kings.
Devils: Hughes continued his strong start and is second on the team with 38 points. Bratt leads the Devils with 39 points, including 13 goals.
NJ leads series 1-0
Scoring Summary
 |
Goal | 2nd Period 16:41 | Jordan Spence Goal (2) Slap Shot, assists: Alex Laferriere (10), Phillip Danault (12) |
 |
Goal | 2nd Period 18:56 | Ondrej Palat Goal (5) Tip-In, assists: Jack Hughes (25), Jesper Bratt (26) |
 |
Goal | 3rd Period 12:58 | Jack Hughes Goal (12) Wrist Shot, assists: Ondrej Palat (6), Brenden Dillon (7) |
 |
Goal | 3rd Period 17:17 | Brett Pesce Goal (1) Wrist Shot, assists: Jack Hughes (26) |
Statistics
 LA LA |
 NJ NJ |
|
|---|---|---|
| 20 | Blocked Shots | 16 |
| 18 | Hits | 27 |
| 7 | Takeaways | 4 |
| 14 | Shots | 26 |
| 0 | Power Play Goals | 0 |
| 1 | Power Play Opportunities | 1 |
| 0.0 | Power Play Percentage | 0.0 |
| 0 | Short Handed Goals | 1 |
| 0 | Shootout Goals | 0 |
| 28 | Faceoffs Won | 22 |
| 56.0 | Faceoff Win Percent | 44.0 |
| 20 | Giveaways | 15 |
| 1 | Total Penalties | 1 |
| 2 | Penalty Minutes | 2 |
Game Information
 Prudential Center
Location: Newark, NJ
Attendance: 15,051 | Capacity:

Location: Newark, NJ
Attendance: 15,051 | Capacity:
2024-25 Pacific Division Standings
| TEAM | W | L | PTS | OTL |
|---|---|---|---|---|
 Vegas Vegas |
28 | 9 | 59 | 3 |
 Edmonton Edmonton |
25 | 12 | 53 | 3 |
 Los Angeles Los Angeles |
23 | 10 | 51 | 5 |
 Vancouver Vancouver |
18 | 12 | 45 | 9 |
 Calgary Calgary |
19 | 14 | 45 | 7 |
 Anaheim Anaheim |
17 | 18 | 39 | 5 |
 Seattle Seattle |
17 | 21 | 37 | 3 |
 San Jose San Jose |
13 | 24 | 32 | 6 |
2024-25 Metropolitan Division Standings
| TEAM | W | L | PTS | OTL |
|---|---|---|---|---|
 Washington Washington |
26 | 10 | 56 | 4 |
 New Jersey New Jersey |
25 | 15 | 53 | 3 |
 Carolina Carolina |
24 | 15 | 50 | 2 |
 Columbus Columbus |
18 | 17 | 42 | 6 |
 Pittsburgh Pittsburgh |
17 | 17 | 42 | 8 |
 Philadelphia Philadelphia |
17 | 19 | 39 | 5 |
 NY Rangers NY Rangers |
18 | 20 | 38 | 2 |
 NY Islanders NY Islanders |
15 | 18 | 37 | 7 |

