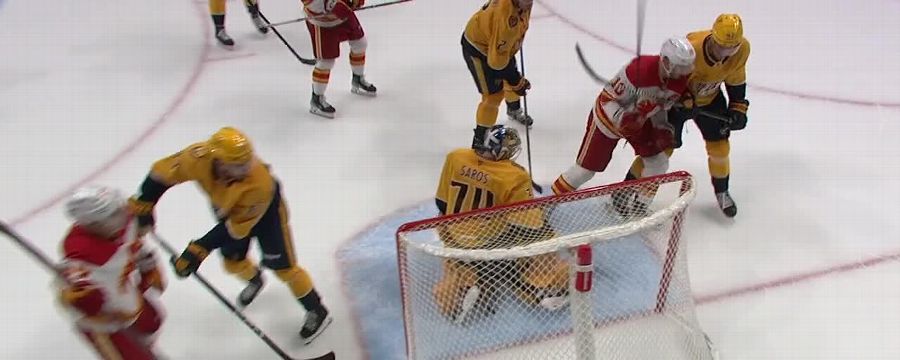
Calgary Flames at Nashville Predators
· National Hockey LeagueHuberdeau and Rooney lead Flames over Predators 4-3 to snap 8-game road skid

Brayden Pachal and Nazem Kadri also scored and Dan Vladar made 17 saves for the Flames, who had lost six of seven.
Jonathan Marchessault scored twice and Tommy Novak had a goal for the Predators, who tied a franchise record with their eighth straight loss. Juuse Saros made 24 saves.
Predators captain Roman Josi did not play in the final two periods due to a lower-body injury. The defenseman logs by far the most ice time of any player on the team at 25:40 per game.
Nashville was already without regular defensemen Jeremy Lauzon and Alexandre Carrier, both sidelined due to injury.
Predators: Playing a depleted lineup due to injury and illness, the Predators got goals from players who have struggled to hit the scoresheet all season, including Marchessault’s first two-goal game with Nashville. Marchessault signed a $27.5 million, five-year contract in the offseason.
CGY leads series 2-0
Scoring Summary
 |
Goal | 1st Period 7:45 | Jonathan Marchessault Goal (6) Tip-In, assists: Steven Stamkos (7), Filip Forsberg (9) |
 |
Goal | 1st Period 10:22 | Nazem Kadri Goal (9) Wrist Shot, assists: Jonathan Huberdeau (9) |
 |
Goal | 1st Period 10:52 | Tommy Novak Goal (4) Snap Shot, assists: Mark Jankowski (5), Luke Evangelista (9) |
 |
Goal | 2nd Period 2:27 | Kevin Rooney Goal (3) Deflected, assists: Walker Duehr (1) |
 |
Goal | 2nd Period 7:41 | Jonathan Marchessault Goal (7) Wrist Shot, assists: Filip Forsberg (10) |
 |
Goal | 2nd Period 13:49 | Brayden Pachal Goal (1) Wrist Shot, assists: Jakob Pelletier (1), Kevin Rooney (1) |
 |
Goal | 2nd Period 18:41 | Jonathan Huberdeau Goal (10) Backhand, assists: Matt Coronato (5), Connor Zary (9) |
Statistics
 CGY CGY |
 NSH NSH |
|
|---|---|---|
| 21 | Blocked Shots | 13 |
| 21 | Hits | 28 |
| 7 | Takeaways | 4 |
| 28 | Shots | 20 |
| 1 | Power Play Goals | 0 |
| 2 | Power Play Opportunities | 2 |
| 50.0 | Power Play Percentage | 0.0 |
| 0 | Short Handed Goals | 0 |
| 0 | Shootout Goals | 0 |
| 23 | Faceoffs Won | 30 |
| 43.4 | Faceoff Win Percent | 56.6 |
| 13 | Giveaways | 13 |
| 2 | Total Penalties | 2 |
| 4 | Penalty Minutes | 4 |
 Nashville Predators Injuries
| NAME, POS | STATUS | DATE |
|---|---|---|
| Jonathan Marchessault, RW | Day-To-Day | Dec 22 |
 Calgary Flames Injuries
| NAME, POS | STATUS | DATE |
|---|---|---|
| Jake Bean, D | Injured Reserve | Dec 18 |
| Zayne Parekh, D | Out | Dec 12 |
Game Information
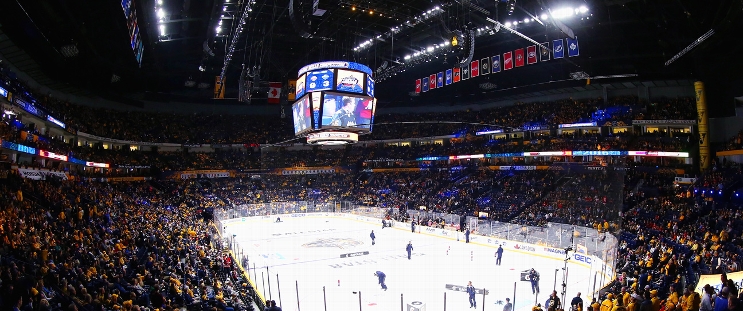
 Bridgestone Arena
Location: Nashville, TN
Attendance: 17,159 | Capacity:

Location: Nashville, TN
Attendance: 17,159 | Capacity:
2025-26 Pacific Division Standings
| TEAM | W | L | PTS | OTL |
|---|---|---|---|---|
 Anaheim Anaheim |
21 | 14 | 44 | 2 |
 Vegas Vegas |
16 | 8 | 42 | 10 |
 Edmonton Edmonton |
18 | 13 | 42 | 6 |
 Los Angeles Los Angeles |
15 | 11 | 39 | 9 |
 San Jose San Jose |
17 | 16 | 37 | 3 |
 Seattle Seattle |
14 | 14 | 34 | 6 |
 Calgary Calgary |
15 | 17 | 34 | 4 |
 Vancouver Vancouver |
15 | 18 | 33 | 3 |
2025-26 Central Division Standings
| TEAM | W | L | PTS | OTL |
|---|---|---|---|---|
 Colorado Colorado |
26 | 2 | 59 | 7 |
 Dallas Dallas |
25 | 7 | 55 | 5 |
 Minnesota Minnesota |
22 | 10 | 49 | 5 |
 Utah Utah |
18 | 17 | 39 | 3 |
 St. Louis St. Louis |
14 | 16 | 36 | 8 |
 Nashville Nashville |
15 | 16 | 34 | 4 |
 Winnipeg Winnipeg |
15 | 17 | 33 | 3 |
 Chicago Chicago |
13 | 16 | 32 | 6 |

