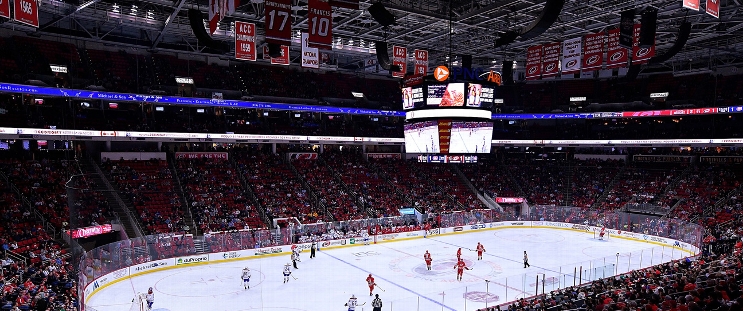
San Jose Sharks at Carolina Hurricanes
· National Hockey LeagueJalen Chatfield scores in 3rd period as the Hurricanes beat the Sharks 3-2

Chatfield caught a high clearing attempt at the top of the right circle, then dropped the puck and pushed a shot at the goal that snuck under Vitek Vanecek’s right arm. It was Chatfield's third goal of the season.
Luke Kunin scored both of San Jose’s goals. Vanecek made 25 saves in the Sharks’ first game since they traded goalie Mackenzie Blackwood to Colorado on Monday.
Brent Burns and Shayne Gostisbehere also scored for Carolina. Pyotr Kochetkov stopped 21 shots.
Gostisbehere gave Carolina a 1-0 lead 4:26 into the first period but his turnover in the second period led to Kunin’s second goal and a 2-1 San Jose lead.
Hurricanes: Fighting through a mini-slump (with losses in four of the previous five games), Carolina could ill afford a home loss to one of the worst teams in the Western Conference. Vanecek made a breakaway save on Jordan Martinook in the second period and a point-blank save on Sebastian Aho in the third but the Canes kept pushing to pick up the home win.
CAR leads series 1-0
Scoring Summary
 |
Goal | 1st Period 4:26 | Shayne Gostisbehere Goal (6) Snap Shot, assists: William Carrier (4), Jack Roslovic (4) |
 |
Goal | 1st Period 18:51 | Luke Kunin Goal (7) Snap Shot, assists: Macklin Celebrini (8), Cody Ceci (6) |
 |
Goal | 2nd Period 11:44 | Luke Kunin Goal (8) Wrist Shot, assists: William Eklund (19) |
 |
Goal | 3rd Period 4:11 | Brent Burns Goal (2) Snap Shot, assists: Sebastian Aho (23), Martin Necas (29) |
 |
Goal | 3rd Period 17:21 | Jalen Chatfield Goal (3) Wrist Shot, assists: none |
Statistics
 SJ SJ |
 CAR CAR |
|
|---|---|---|
| 19 | Blocked Shots | 19 |
| 34 | Hits | 31 |
| 8 | Takeaways | 6 |
| 23 | Shots | 28 |
| 0 | Power Play Goals | 0 |
| 3 | Power Play Opportunities | 4 |
| 0.0 | Power Play Percentage | 0.0 |
| 0 | Short Handed Goals | 0 |
| 0 | Shootout Goals | 0 |
| 29 | Faceoffs Won | 23 |
| 55.8 | Faceoff Win Percent | 44.2 |
| 17 | Giveaways | 15 |
| 4 | Total Penalties | 3 |
| 8 | Penalty Minutes | 6 |
 Carolina Hurricanes Injuries
| NAME, POS | STATUS | DATE |
|---|---|---|
| Eric Robinson, LW | Day-To-Day | Feb 6 |
| Pyotr Kochetkov, G | Injured Reserve | Dec 29 |
 San Jose Sharks Injuries
| NAME, POS | STATUS | DATE |
|---|---|---|
| Tyler Toffoli, C | Day-To-Day | Feb 18 |
| Ryan Reaves, RW | Injured Reserve | Feb 18 |
| Ty Dellandrea, C | Injured Reserve | Jan 15 |
| Logan Couture, C | Injured Reserve | Sep 30 |
Game Information
 Lenovo Center
Location: Raleigh, NC
Attendance: 18,700 | Capacity:

Location: Raleigh, NC
Attendance: 18,700 | Capacity:
2025-26 Pacific Division Standings
| TEAM | W | L | PTS | OTL |
|---|---|---|---|---|
 Vegas Vegas |
27 | 16 | 68 | 14 |
 Edmonton Edmonton |
28 | 22 | 64 | 8 |
 Seattle Seattle |
27 | 20 | 63 | 9 |
 Anaheim Anaheim |
30 | 23 | 63 | 3 |
 Los Angeles Los Angeles |
23 | 19 | 60 | 14 |
 San Jose San Jose |
27 | 24 | 58 | 4 |
 Calgary Calgary |
23 | 27 | 52 | 6 |
 Vancouver Vancouver |
18 | 33 | 42 | 6 |
2025-26 Metropolitan Division Standings
| TEAM | W | L | PTS | OTL |
|---|---|---|---|---|
 Carolina Carolina |
36 | 15 | 78 | 6 |
 Pittsburgh Pittsburgh |
29 | 15 | 70 | 12 |
 NY Islanders NY Islanders |
32 | 21 | 69 | 5 |
 Columbus Columbus |
29 | 20 | 65 | 7 |
 Washington Washington |
29 | 23 | 65 | 7 |
 Philadelphia Philadelphia |
25 | 20 | 61 | 11 |
 New Jersey New Jersey |
28 | 27 | 58 | 2 |
 NY Rangers NY Rangers |
22 | 29 | 50 | 6 |

