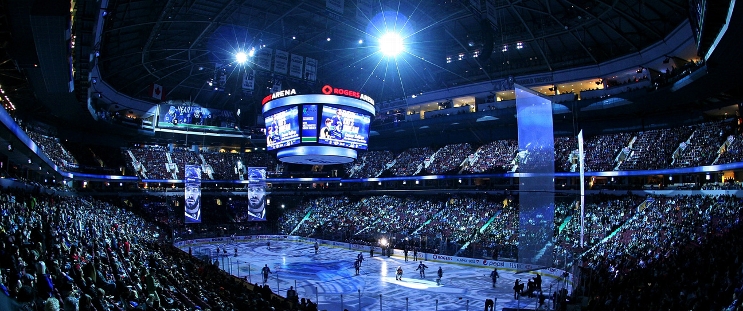
Tampa Bay Lightning at Vancouver Canucks
· National Hockey League
Regular Season Series
TB leads series 1-0
Statistics
 TB TB |
 VAN VAN |
|
|---|---|---|
| 3.05 | Goals Against per Game | 3.21 |
| 28.4 | Shots Against per Game | 27.8 |
| 76.3 | Penalty Kill Percentage | 78.6 |
| 14 | Power Play Goals Against | 12 |
| 0 | Short Handed Goals Against | 0 |
| 3.58 | Goals For per Game | 3.21 |
| 27.6 | Shots per Game | 27.6 |
| 12 | Power Play Goals | 12 |
| 20.3 | Power Play Percentage | 20.3 |
| 2 | Short Handed Goals | 0 |
| 177 | Penalty Minutes | 176 |
 Vancouver Canucks Injuries
| NAME, POS | STATUS | DATE |
|---|---|---|
| Brock Boeser, RW | Day-To-Day | Nov 25 |
| J.T. Miller, C | Injured Reserve | Nov 19 |
| Conor Garland, RW | Day-To-Day | Nov 19 |
| Derek Forbort, D | Injured Reserve | Nov 17 |
| Dakota Joshua, C | Injured Reserve | Nov 6 |
 Tampa Bay Lightning Injuries
| NAME, POS | STATUS | DATE |
|---|---|---|
| Nick Paul, LW | Out | Nov 25 |
| Brayden Point, C | Day-To-Day | Nov 18 |
| Erik Cernak, D | Day-To-Day | Nov 7 |
| Michael Eyssimont, C | Injured Reserve | Oct 11 |
| Luke Glendening, C | Day-To-Day | Oct 11 |
Game Information
 Rogers Arena
Location: Vancouver, BC
Capacity:

Rogers Arena
Location: Vancouver, BC
Capacity:
2024-25 Atlantic Division Standings
| TEAM | W | L | PTS | OTL |
|---|---|---|---|---|
 Toronto Toronto |
13 | 6 | 28 | 2 |
 Florida Florida |
12 | 8 | 25 | 1 |
 Buffalo Buffalo |
11 | 9 | 23 | 1 |
 Boston Boston |
10 | 9 | 23 | 3 |
 Tampa Bay Tampa Bay |
10 | 7 | 22 | 2 |
 Detroit Detroit |
8 | 10 | 18 | 2 |
 Ottawa Ottawa |
8 | 11 | 17 | 1 |
 Montreal Montreal |
7 | 11 | 16 | 2 |
2024-25 Pacific Division Standings
| TEAM | W | L | PTS | OTL |
|---|---|---|---|---|
 Vegas Vegas |
13 | 6 | 28 | 2 |
 Calgary Calgary |
12 | 6 | 27 | 3 |
 Los Angeles Los Angeles |
11 | 7 | 25 | 3 |
 Edmonton Edmonton |
11 | 9 | 24 | 2 |
 Vancouver Vancouver |
10 | 6 | 23 | 3 |
 Seattle Seattle |
10 | 10 | 21 | 1 |
 Anaheim Anaheim |
8 | 8 | 19 | 3 |
 San Jose San Jose |
6 | 12 | 17 | 5 |


 WPG
WPG NJ
NJ PIT
PIT CBJ
CBJ DAL
DAL NYI
NYI CHI
CHI NSH
NSH NYR
NYR