Nashville Predators at Ottawa Senators
· National Hockey LeagueGiroux helps the Senators beat the struggling Predators 3-1

Tim Stutzle had two assists for Ottawa in its second straight win. Linus Ullmark made 37 saves.
Nashville dropped to 0-4-3 during a seven-game slide.
The Senators went ahead to stay with two goals in the second.
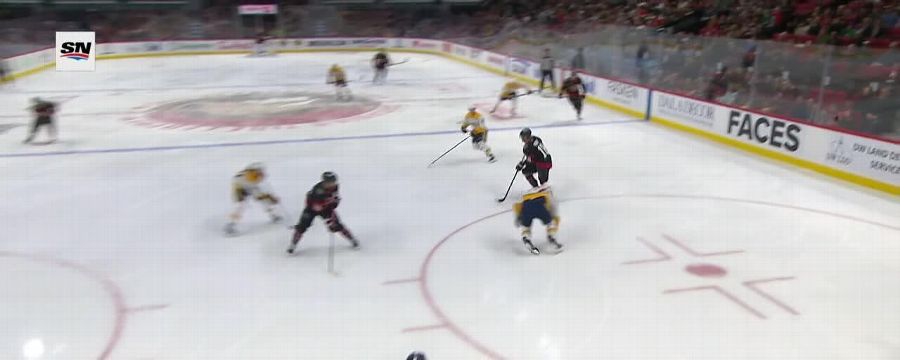
Bernard-Docker got a pass from Stutzle and wristed a shot from the faceoff circle that beat Juuse Saros for his first of the season. Giroux made it 2-0 when his shot deflected off the skate of Nashville’s Steven Stamkos at 16:52.
Saros stopped 27 shots.
The Predators pushed hard late in the second. Roman Josi rang a shot off the crossbar and then Ullmark made a couple big saves.
Cousins made it 3-1 with his third of the season midway through the third.
Ullmark lost his shutout bid when Fedor Svechkov scored with 1:57 left. It was Svechkov's second goal of the season.
Predators: Nashville’s penalty killers continue to be a bright spot through this challenging stretch as they were a perfect 3 for 3 on the night.
OTT leads series 1-0
Scoring Summary
 |
Goal | 2nd Period 5:07 | Jacob Bernard-Docker Goal (1) Wrist Shot, assists: Tim Stützle (21), Adam Gaudette (2) |
 |
Goal | 2nd Period 16:52 | Claude Giroux Goal (7) Wrist Shot, assists: Tim Stützle (22) |
 |
Goal | 3rd Period 12:37 | Nick Cousins Goal (3) Snap Shot, assists: Michael Amadio (4) |
 |
Goal | 3rd Period 18:03 | Fedor Svechkov Goal (2) Wrist Shot, assists: Mark Jankowski (4), Zachary L'Heureux (4) |
Statistics
 NSH NSH |
 OTT OTT |
|
|---|---|---|
| 17 | Blocked Shots | 16 |
| 25 | Hits | 24 |
| 3 | Takeaways | 5 |
| 37 | Shots | 30 |
| 0 | Power Play Goals | 0 |
| 1 | Power Play Opportunities | 3 |
| 0.0 | Power Play Percentage | 0.0 |
| 0 | Short Handed Goals | 0 |
| 0 | Shootout Goals | 0 |
| 32 | Faceoffs Won | 41 |
| 43.8 | Faceoff Win Percent | 56.2 |
| 11 | Giveaways | 8 |
| 4 | Total Penalties | 2 |
| 11 | Penalty Minutes | 7 |
 Ottawa Senators Injuries
| NAME, POS | STATUS | DATE |
|---|---|---|
| Linus Ullmark, G | Day-To-Day | Feb 6 |
| David Perron, LW | Injured Reserve | Jan 23 |
 Nashville Predators Injuries
| NAME, POS | STATUS | DATE |
|---|
Game Information
 Canadian Tire Centre
Location: Ottawa, ON
Attendance: 16,741 | Capacity:

Location: Ottawa, ON
Attendance: 16,741 | Capacity:
2025-26 Central Division Standings
| TEAM | W | L | PTS | OTL |
|---|---|---|---|---|
 Colorado Colorado |
37 | 9 | 83 | 9 |
 Minnesota Minnesota |
34 | 14 | 78 | 10 |
 Dallas Dallas |
34 | 14 | 77 | 9 |
 Utah Utah |
30 | 23 | 64 | 4 |
 Nashville Nashville |
26 | 24 | 59 | 7 |
 Chicago Chicago |
22 | 26 | 53 | 9 |
 Winnipeg Winnipeg |
22 | 26 | 52 | 8 |
 St. Louis St. Louis |
20 | 28 | 49 | 9 |
2025-26 Atlantic Division Standings
| TEAM | W | L | PTS | OTL |
|---|---|---|---|---|
 Tampa Bay Tampa Bay |
37 | 14 | 78 | 4 |
 Montreal Montreal |
32 | 17 | 72 | 8 |
 Detroit Detroit |
33 | 19 | 72 | 6 |
 Buffalo Buffalo |
32 | 19 | 70 | 6 |
 Boston Boston |
32 | 20 | 69 | 5 |
 Ottawa Ottawa |
28 | 22 | 63 | 7 |
 Toronto Toronto |
27 | 21 | 63 | 9 |
 Florida Florida |
29 | 25 | 61 | 3 |

