Philadelphia Flyers at Boston Bruins
· National Hockey LeagueZacha scores in overtime as the Bruins rally past the Flyers for their 4th straight win

Boston’s Brad Marchand tied it with 5:22 left in regulation. Trent Frederic had the other two goals for Boston, which is 7-2 since interim coach Joe Sacco took over for fired coach Jim Montgomery.
Zacha scored the winner after Boston goalie Jeremy Swayman stopped Joel Farabee’s breakaway seconds earlier.
Rookie Matvei Michkov scored two first-period goals for Philadelphia in its second straight loss. Cam York also scored, and Travis Sanheim had two assists.
Coming off a frustrating loss against Florida when they gave up a season-high seven goals, the Flyers blew a third-period lead for the second game in a row.
Michkov scored a power-play goal at 7:24 when he one-timed a shot from the right circle off a short tip pass from Sean Couturier. His second came on a redirected shot at the edge of the crease.
Bruins: Sacco used star winger David Pastrnak on the top line with Brad Marchand for the second straight game and the first two times this season after Marchand scored two goals in Boston’s last game.
BOS wins series 2-1
Scoring Summary
 |
Goal | 1st Period 7:24 | Matvei Michkov Goal (10) Wrist Shot, assists: Sean Couturier (9), Emil Andrae (4) |
 |
Goal | 1st Period 18:24 | Matvei Michkov Goal (11) Wrist Shot, assists: Travis Sanheim (11) |
 |
Goal | 2nd Period 5:26 | Trent Frederic Goal (4) Backhand, assists: Mason Lohrei (11), Morgan Geekie (5) |
 |
Goal | 2nd Period 15:29 | Cam York Goal (3) Wrist Shot, assists: Travis Sanheim (12), Travis Konecny (18) |
 |
Goal | 3rd Period 5:18 | Trent Frederic Goal (5) Snap Shot, assists: Charlie Coyle (2), Mark Kastelic (7) |
 |
Goal | 3rd Period 14:38 | Brad Marchand Goal (11) Wrist Shot, assists: Justin Brazeau (8) |
 |
Goal | 4th Period 2:49 | Pavel Zacha Goal (7) Snap Shot, assists: David Pastrnak (18) |
Statistics
 PHI PHI |
 BOS BOS |
|
|---|---|---|
| 18 | Blocked Shots | 9 |
| 18 | Hits | 33 |
| 1 | Takeaways | 6 |
| 26 | Shots | 31 |
| 1 | Power Play Goals | 1 |
| 2 | Power Play Opportunities | 6 |
| 50.0 | Power Play Percentage | 16.7 |
| 0 | Short Handed Goals | 0 |
| 0 | Shootout Goals | 0 |
| 35 | Faceoffs Won | 33 |
| 51.5 | Faceoff Win Percent | 48.5 |
| 18 | Giveaways | 19 |
| 8 | Total Penalties | 4 |
| 16 | Penalty Minutes | 8 |
Game Information
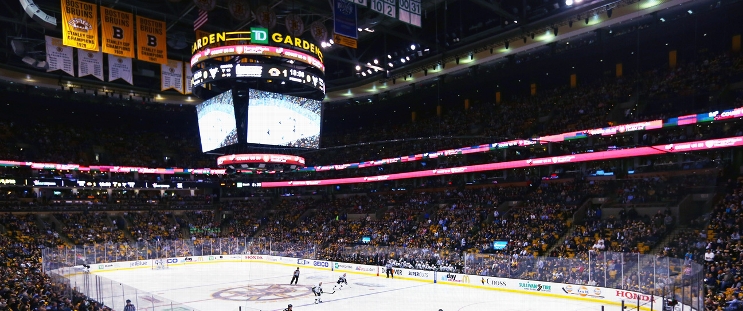
 TD Garden
Location: Boston, MA
Attendance: 17,850 | Capacity:

Location: Boston, MA
Attendance: 17,850 | Capacity:
2024-25 Metropolitan Division Standings
| TEAM | W | L | PTS | OTL |
|---|---|---|---|---|
 Washington Washington |
26 | 10 | 56 | 4 |
 New Jersey New Jersey |
25 | 15 | 53 | 3 |
 Carolina Carolina |
24 | 15 | 50 | 2 |
 Columbus Columbus |
18 | 17 | 42 | 6 |
 Pittsburgh Pittsburgh |
17 | 17 | 42 | 8 |
 Philadelphia Philadelphia |
17 | 19 | 39 | 5 |
 NY Rangers NY Rangers |
18 | 20 | 38 | 2 |
 NY Islanders NY Islanders |
15 | 18 | 37 | 7 |
2024-25 Atlantic Division Standings
| TEAM | W | L | PTS | OTL |
|---|---|---|---|---|
 Toronto Toronto |
27 | 13 | 56 | 2 |
 Florida Florida |
24 | 15 | 50 | 2 |
 Boston Boston |
20 | 18 | 45 | 5 |
 Tampa Bay Tampa Bay |
21 | 15 | 44 | 2 |
 Ottawa Ottawa |
19 | 17 | 41 | 3 |
 Montreal Montreal |
19 | 18 | 41 | 3 |
 Detroit Detroit |
18 | 18 | 40 | 4 |
 Buffalo Buffalo |
15 | 21 | 35 | 5 |

