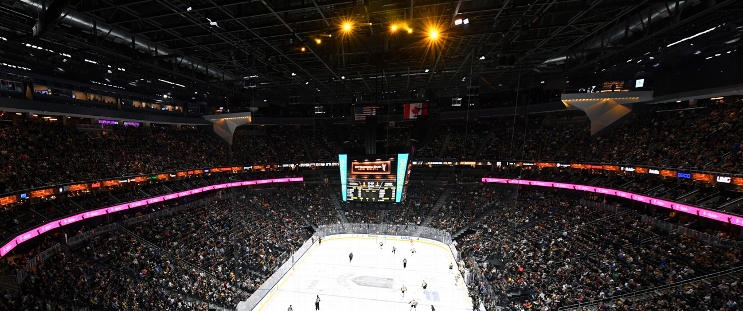
Dallas Stars at Vegas Golden Knights
· National Hockey LeagueGolden Knights ride power play to 3-2 win over Stars in Mark Stone's return from injury

Tomas Hertl and Jack Eichel scored with the man advantage for the Golden Knights, and Nicolas Roy had an even-strength goal. Shea Theodore had two assists, and Adin Hill made 37 saves to improve to 6-1-1 over his past eight starts.
Mavrik Bourque and Mason Marchment scored for the Stars, and Jake Oettinger made 25 stops.
Vegas has won three games in a row and is 7-1-1 over its past nine.
Stone played for the first time since Nov. 6 at Edmonton. Stone, who had been out with a pulled muscle, rejoined the top line of Eichel and Ivan Barbashev and had the primary assist on Hertl's goal.
Dallas beat the Golden Knights in seven games in last season's playoffs. This was the teams' first meeting since then.
Golden Knights: Dallas' 39 shots on goal were misleading. The Golden Knights forced the Stars to often shoot from the perimeter, the third game in a row Vegas' defense forced the action.
VGK leads series 1-0
Scoring Summary
 |
Goal | 1st Period 15:23 | Tomas Hertl Goal (9) Wrist Shot, assists: Mark Stone (16), Shea Theodore (18) |
 |
Goal | 2nd Period 6:39 | Mavrik Bourque Goal (2) Wrist Shot, assists: Oskar Bäck (4), Colin Blackwell (4) |
 |
Goal | 2nd Period 15:40 | Jack Eichel Goal (9) Slap Shot, assists: Shea Theodore (19) |
 |
Goal | 2nd Period 16:48 | Nicolas Roy Goal (6) Snap Shot, assists: none |
 |
Goal | 3rd Period 17:26 | Mason Marchment Goal (12) Wrist Shot, assists: Wyatt Johnston (11), Miro Heiskanen (10) |
Statistics
 DAL DAL |
 VGK VGK |
|
|---|---|---|
| 14 | Blocked Shots | 18 |
| 15 | Hits | 19 |
| 4 | Takeaways | 8 |
| 40 | Shots | 28 |
| 0 | Power Play Goals | 2 |
| 2 | Power Play Opportunities | 6 |
| 0.0 | Power Play Percentage | 33.3 |
| 0 | Short Handed Goals | 0 |
| 0 | Shootout Goals | 0 |
| 32 | Faceoffs Won | 32 |
| 50.0 | Faceoff Win Percent | 50.0 |
| 29 | Giveaways | 22 |
| 5 | Total Penalties | 2 |
| 12 | Penalty Minutes | 4 |
Game Information
 T-Mobile Arena
Location: Las Vegas, NV
Attendance: 17,961 | Capacity:

Location: Las Vegas, NV
Attendance: 17,961 | Capacity:
2024-25 Central Division Standings
| TEAM | W | L | PTS | OTL |
|---|---|---|---|---|
 Winnipeg Winnipeg |
28 | 12 | 58 | 2 |
 Minnesota Minnesota |
26 | 11 | 56 | 4 |
 Dallas Dallas |
25 | 13 | 51 | 1 |
 Colorado Colorado |
25 | 15 | 51 | 1 |
 St. Louis St. Louis |
19 | 19 | 42 | 4 |
 Utah Utah |
17 | 15 | 41 | 7 |
 Nashville Nashville |
13 | 21 | 33 | 7 |
 Chicago Chicago |
13 | 25 | 28 | 2 |
2024-25 Pacific Division Standings
| TEAM | W | L | PTS | OTL |
|---|---|---|---|---|
 Vegas Vegas |
28 | 9 | 59 | 3 |
 Edmonton Edmonton |
25 | 12 | 53 | 3 |
 Los Angeles Los Angeles |
23 | 10 | 51 | 5 |
 Vancouver Vancouver |
18 | 12 | 45 | 9 |
 Calgary Calgary |
19 | 14 | 45 | 7 |
 Anaheim Anaheim |
17 | 18 | 39 | 5 |
 Seattle Seattle |
17 | 21 | 37 | 3 |
 San Jose San Jose |
13 | 24 | 32 | 6 |

