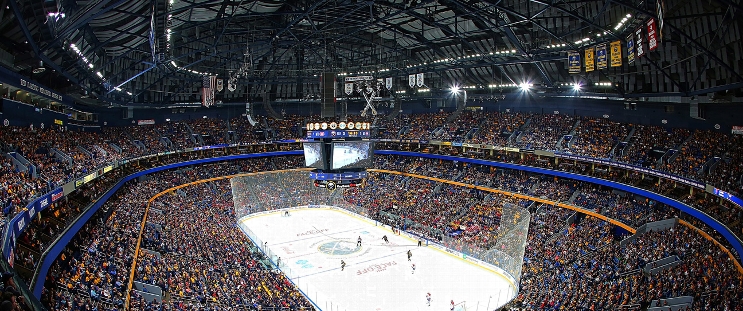
Winnipeg Jets at Buffalo Sabres
· National Hockey LeagueAdam Lowry scores in OT to give Jets 3-2 win over Sabres and end 4-game skid

Gabriel Vilardi and Kyle Connor also scored for Winnipeg, and Connor Hellebuyck made 28 saves. The Jets' losing streak was their longest this season, and Winnipeg is 4-7-0 after starting the season 15-1-0.
Tage Thompson and Dylan Cozens scored for the Sabres, who are winless in their past five games (0-3-2). Ukko-Pekka Luukkonen also made 28 saves.
Lowry’s winning goal came on a rebound from defenseman Josh Morrissey’s shot that slid to the left of Luukkonen in the crease.
Sabres head coach Lindy Ruff became the fourth coach to reach the 1,800-game mark behind the bench joining Barry Trotz, Paul Maurice and Scotty Bowman.
Sabres: Thompson’s power-play goal in the first period ended a run of 16 consecutive power plays without a goal. The most recent one before that came Nov. 20 in Los Angeles from Jason Zucker.
WPG leads series 1-0
Scoring Summary
 |
Goal | 1st Period 3:27 | Tage Thompson Goal (14) Wrist Shot, assists: Jason Zucker (11), Alex Tuch (16) |
 |
Goal | 1st Period 4:14 | Gabriel Vilardi Goal (10) Wrist Shot, assists: Haydn Fleury (4), Mark Scheifele (15) |
 |
Goal | 1st Period 11:29 | Dylan Cozens Goal (6) Tip-In, assists: Zach Benson (5), Connor Clifton (6) |
 |
Goal | 2nd Period 3:06 | Kyle Connor Goal (14) Slap Shot, assists: Mark Scheifele (16), Josh Morrissey (22) |
 |
Goal | 4th Period 3:59 | Adam Lowry Goal (7) Wrist Shot, assists: Josh Morrissey (23), Gabriel Vilardi (9) |
Statistics
 WPG WPG |
 BUF BUF |
|
|---|---|---|
| 18 | Blocked Shots | 15 |
| 15 | Hits | 28 |
| 3 | Takeaways | 1 |
| 31 | Shots | 30 |
| 1 | Power Play Goals | 1 |
| 5 | Power Play Opportunities | 3 |
| 20.0 | Power Play Percentage | 33.3 |
| 0 | Short Handed Goals | 0 |
| 0 | Shootout Goals | 0 |
| 37 | Faceoffs Won | 30 |
| 55.2 | Faceoff Win Percent | 44.8 |
| 16 | Giveaways | 16 |
| 6 | Total Penalties | 8 |
| 23 | Penalty Minutes | 27 |
Game Information
 KeyBank Center
Location: Buffalo, NY
Attendance: 14,497 | Capacity:

Location: Buffalo, NY
Attendance: 14,497 | Capacity:
2024-25 Central Division Standings
| TEAM | W | L | PTS | OTL |
|---|---|---|---|---|
 Winnipeg Winnipeg |
27 | 12 | 56 | 2 |
 Minnesota Minnesota |
25 | 11 | 54 | 4 |
 Colorado Colorado |
25 | 15 | 51 | 1 |
 Dallas Dallas |
24 | 13 | 49 | 1 |
 St. Louis St. Louis |
19 | 18 | 42 | 4 |
 Utah Utah |
17 | 15 | 41 | 7 |
 Nashville Nashville |
13 | 20 | 33 | 7 |
 Chicago Chicago |
13 | 25 | 28 | 2 |
2024-25 Atlantic Division Standings
| TEAM | W | L | PTS | OTL |
|---|---|---|---|---|
 Toronto Toronto |
26 | 13 | 54 | 2 |
 Florida Florida |
24 | 15 | 50 | 2 |
 Boston Boston |
20 | 17 | 45 | 5 |
 Tampa Bay Tampa Bay |
20 | 15 | 42 | 2 |
 Montreal Montreal |
19 | 18 | 41 | 3 |
 Ottawa Ottawa |
19 | 17 | 40 | 2 |
 Detroit Detroit |
17 | 18 | 38 | 4 |
 Buffalo Buffalo |
15 | 21 | 35 | 5 |

