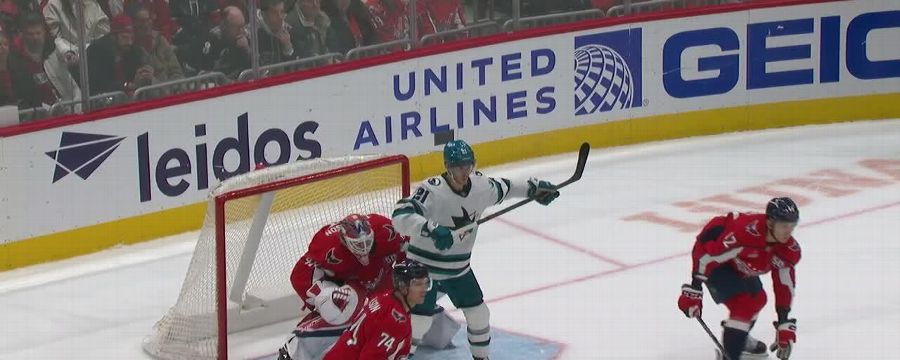
San Jose Sharks at Washington Capitals
· National Hockey LeagueEklund scores in OT, Sharks beat Capitals 2-1 for their 3rd win in a row

The Capitals fell to 4-2-1 since captain and leading goal-scorer Alex Ovechkin was sidelined by a broken left fibula. They fell behind early and failed to make it five comeback victories in a row, despite Logan Thompson making 29 saves and Nic Dowd scoring his seventh goal of the season.
Blackwood was dominant at the other end, turning aside quality chances and keeping Washington off the scoreboard on three power plays. Tyler Toffoli scored with one minute left in the first period, and the Sharks won their third in a row.
Macklin Celebrini picked up the secondary assist on Eklund's OT winner to extend his point streak to five games. The top pick in the draft has four goals and four assists during this stretch.
Capitals: On a positive note, they did not allow four or more goals, as they have in the past three games. But they also lost their recent scoring touch, failing to adjust to the shots Blackwood was stopping with some ease.
SJ leads series 1-0
Scoring Summary
 |
Goal | 1st Period 19:00 | Tyler Toffoli Goal (10) Wrist Shot, assists: none |
 |
Goal | 2nd Period 13:02 | Nic Dowd Goal (7) Slap Shot, assists: Martin Fehervary (6), Ivan Miroshnichenko (3) |
 |
Goal | 4th Period 0:39 | William Eklund Goal (5) Slap Shot, assists: Mikael Granlund (19), Macklin Celebrini (7) |
Statistics
 SJ SJ |
 WSH WSH |
|
|---|---|---|
| 19 | Blocked Shots | 24 |
| 30 | Hits | 22 |
| 1 | Takeaways | 0 |
| 31 | Shots | 28 |
| 1 | Power Play Goals | 0 |
| 4 | Power Play Opportunities | 3 |
| 25.0 | Power Play Percentage | 0.0 |
| 0 | Short Handed Goals | 0 |
| 0 | Shootout Goals | 0 |
| 27 | Faceoffs Won | 28 |
| 49.1 | Faceoff Win Percent | 50.9 |
| 23 | Giveaways | 20 |
| 3 | Total Penalties | 4 |
| 6 | Penalty Minutes | 18 |
 Washington Capitals Injuries
| NAME, POS | STATUS | DATE |
|---|---|---|
| Charlie Lindgren, G | Injured Reserve | Feb 17 |
| Connor McMichael, C | Injured Reserve | Jan 31 |
| Eriks Mateiko, LW | Out | Jan 13 |
 San Jose Sharks Injuries
| NAME, POS | STATUS | DATE |
|---|---|---|
| Ryan Reaves, RW | Injured Reserve | Feb 3 |
| Ty Dellandrea, C | Injured Reserve | Jan 15 |
| Logan Couture, C | Injured Reserve | Sep 30 |
Game Information
 Capital One Arena
Location: Washington, DC
Attendance: 17,859 | Capacity:

Location: Washington, DC
Attendance: 17,859 | Capacity:
2025-26 Pacific Division Standings
| TEAM | W | L | PTS | OTL |
|---|---|---|---|---|
 Vegas Vegas |
27 | 16 | 68 | 14 |
 Edmonton Edmonton |
28 | 22 | 64 | 8 |
 Seattle Seattle |
27 | 20 | 63 | 9 |
 Anaheim Anaheim |
30 | 23 | 63 | 3 |
 Los Angeles Los Angeles |
23 | 19 | 60 | 14 |
 San Jose San Jose |
27 | 24 | 58 | 4 |
 Calgary Calgary |
23 | 27 | 52 | 6 |
 Vancouver Vancouver |
18 | 33 | 42 | 6 |
2025-26 Metropolitan Division Standings
| TEAM | W | L | PTS | OTL |
|---|---|---|---|---|
 Carolina Carolina |
36 | 15 | 78 | 6 |
 Pittsburgh Pittsburgh |
29 | 15 | 70 | 12 |
 NY Islanders NY Islanders |
32 | 21 | 69 | 5 |
 Columbus Columbus |
29 | 20 | 65 | 7 |
 Washington Washington |
29 | 23 | 65 | 7 |
 Philadelphia Philadelphia |
25 | 20 | 61 | 11 |
 New Jersey New Jersey |
28 | 27 | 58 | 2 |
 NY Rangers NY Rangers |
22 | 29 | 50 | 6 |

