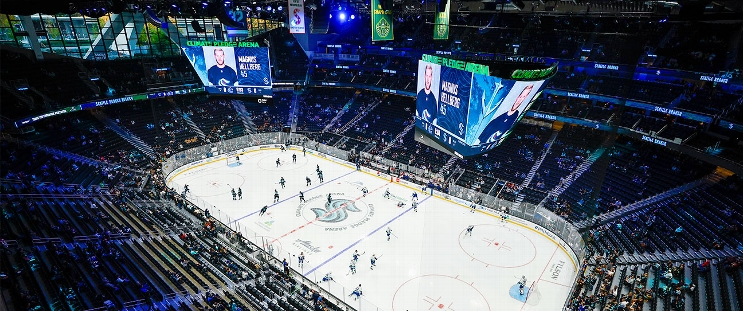
San Jose Sharks at Seattle Kraken
· National Hockey LeagueMikael Granlund and Jake Walman set up all the goals for the Sharks in 4-2 win over the Kraken

The victory was the second in two nights for the Sharks against the Kraken. San Jose seat Seattle 8-5 on Friday.
Mario Ferraro opened the scoring late in the first period with a wrist shot that deflected off of defenseman Will Borgen. Luke Kunin and Cody Ceci and Smith scored in an eight-minute span of the second period as Seattle won for the third time in four games.
The Kraken fell behind 4-0 before Jaden Schwartz scored on a snap shot in the middle period. Jared McCann scored his team-leading 10th goal in the third. Joey Daccord finished with 19 saves.
Sharks: Blackwood won his first start since beating the Detroit Red Wings in overtime on Nov. 18.
SJ leads series 2-0
Scoring Summary
 |
Goal | 1st Period 16:54 | Mario Ferraro Goal (2) Wrist Shot, assists: Mikael Granlund (17), Timothy Liljegren (2) |
 |
Goal | 2nd Period 1:51 | Luke Kunin Goal (6) Wrist Shot, assists: Ty Dellandrea (3), Jake Walman (14) |
 |
Goal | 2nd Period 8:59 | Cody Ceci Goal (1) Snap Shot, assists: Macklin Celebrini (6), Jake Walman (15) |
 |
Goal | 2nd Period 9:45 | Will Smith Goal (5) Wrist Shot, assists: Mikael Granlund (18), Klim Kostin (3) |
 |
Goal | 2nd Period 10:17 | Jaden Schwartz Goal (5) Snap Shot, assists: Matty Beniers (7), Oliver Bjorkstrand (8) |
 |
Goal | 3rd Period 6:27 | Jared McCann Goal (10) Wrist Shot, assists: Ryker Evans (13), Brandon Montour (9) |
Statistics
 SJ SJ |
 SEA SEA |
|
|---|---|---|
| 21 | Blocked Shots | 13 |
| 11 | Hits | 21 |
| 3 | Takeaways | 2 |
| 23 | Shots | 38 |
| 0 | Power Play Goals | 0 |
| 1 | Power Play Opportunities | 2 |
| 0.0 | Power Play Percentage | 0.0 |
| 0 | Short Handed Goals | 0 |
| 0 | Shootout Goals | 0 |
| 29 | Faceoffs Won | 28 |
| 50.9 | Faceoff Win Percent | 49.1 |
| 14 | Giveaways | 16 |
| 2 | Total Penalties | 1 |
| 4 | Penalty Minutes | 2 |
Game Information
 Climate Pledge Arena
Location: Seattle, WA
Attendance: 17,151 | Capacity:

Location: Seattle, WA
Attendance: 17,151 | Capacity:
2024-25 Pacific Division Standings
| TEAM | W | L | PTS | OTL |
|---|---|---|---|---|
 Vegas Vegas |
28 | 9 | 59 | 3 |
 Edmonton Edmonton |
25 | 12 | 53 | 3 |
 Los Angeles Los Angeles |
23 | 10 | 51 | 5 |
 Vancouver Vancouver |
18 | 12 | 46 | 10 |
 Calgary Calgary |
19 | 14 | 45 | 7 |
 Anaheim Anaheim |
17 | 18 | 39 | 5 |
 Seattle Seattle |
17 | 21 | 37 | 3 |
 San Jose San Jose |
13 | 24 | 32 | 6 |

