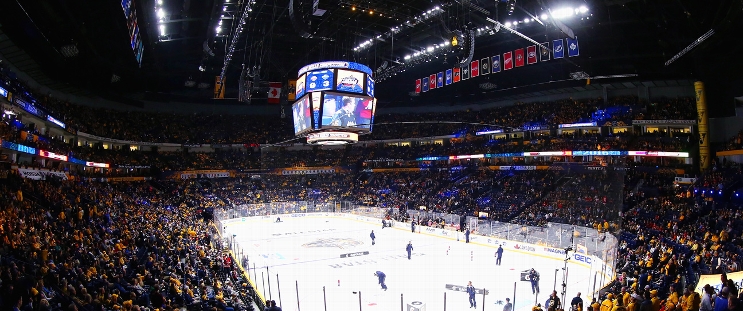
Tampa Bay Lightning at Nashville Predators
· National Hockey LeaguePoint's OT power-play goal gives Lightning 3-2 victory over Predators

Anthony Cirelli and Brandon Hagel also scored and Jonas Johnasson made 29 saves for the Lightning, who have won two of three.
Roman Josi scored twice and Juuse Saros made 25 saves for Nashville, losers of three straight.
Josi scored the game’s first goal at 1:123 of the opening period with a wrist shot through traffic that beat Johansson high to the far side and Cirelli tied it at 4:06 of the second with a shorthanded goal.
Cirelli left the game early in the first after being hit in the face with a shot from teammate Erik Cernak. Cirelli returned to the game later in the first wearing a full protective face shield. Cirelli had a six-game goal scoring streak snapped Wednesday against Washington. With his goal Friday afternoon, Cirelli has eight goals in eight games.
Predators: Back-to-back overtime losses have given the Predators two standings points, but one-point games aren't enough for a team that has had a miserable start to the season and needs victories to get into playoff contention.
TB wins series 2-0
Scoring Summary
 |
Goal | 1st Period 1:23 | Roman Josi Goal (6) Wrist Shot, assists: Steven Stamkos (5) |
 |
Goal | 2nd Period 4:06 | Anthony Cirelli Goal (10) Batted, assists: Luke Glendening (1) |
 |
Goal | 2nd Period 8:18 | Brandon Hagel Goal (10) Tip-In, assists: Darren Raddysh (5), Victor Hedman (16) |
 |
Goal | 2nd Period 11:20 | Roman Josi Goal (7) Wrist Shot, assists: Mark Jankowski (3), Luke Evangelista (7) |
 |
Goal | 4th Period 1:01 | Brayden Point Goal (16) Backhand, assists: Nikita Kucherov (22) |
Statistics
 TB TB |
 NSH NSH |
|
|---|---|---|
| 12 | Blocked Shots | 20 |
| 28 | Hits | 39 |
| 3 | Takeaways | 9 |
| 28 | Shots | 31 |
| 1 | Power Play Goals | 0 |
| 4 | Power Play Opportunities | 2 |
| 25.0 | Power Play Percentage | 0.0 |
| 1 | Short Handed Goals | 0 |
| 0 | Shootout Goals | 0 |
| 30 | Faceoffs Won | 31 |
| 49.2 | Faceoff Win Percent | 50.8 |
| 23 | Giveaways | 24 |
| 3 | Total Penalties | 5 |
| 6 | Penalty Minutes | 10 |
 Nashville Predators Injuries
| NAME, POS | STATUS | DATE |
|---|
 Tampa Bay Lightning Injuries
| NAME, POS | STATUS | DATE |
|---|---|---|
| Victor Hedman, D | Day-To-Day | Feb 18 |
| Nick Paul, LW | Day-To-Day | Feb 6 |
| Anthony Cirelli, C | Day-To-Day | Feb 6 |
| Brayden Point, C | Injured Reserve | Feb 5 |
| Charle-Edouard D'Astous, D | Injured Reserve | Jan 25 |
Game Information
 Bridgestone Arena
Location: Nashville, TN
Attendance: 18,228 | Capacity:

Location: Nashville, TN
Attendance: 18,228 | Capacity:
2025-26 Atlantic Division Standings
| TEAM | W | L | PTS | OTL |
|---|---|---|---|---|
 Tampa Bay Tampa Bay |
37 | 14 | 78 | 4 |
 Montreal Montreal |
32 | 17 | 72 | 8 |
 Detroit Detroit |
33 | 19 | 72 | 6 |
 Buffalo Buffalo |
32 | 19 | 70 | 6 |
 Boston Boston |
32 | 20 | 69 | 5 |
 Ottawa Ottawa |
28 | 22 | 63 | 7 |
 Toronto Toronto |
27 | 21 | 63 | 9 |
 Florida Florida |
29 | 25 | 61 | 3 |
2025-26 Central Division Standings
| TEAM | W | L | PTS | OTL |
|---|---|---|---|---|
 Colorado Colorado |
37 | 9 | 83 | 9 |
 Minnesota Minnesota |
34 | 14 | 78 | 10 |
 Dallas Dallas |
34 | 14 | 77 | 9 |
 Utah Utah |
30 | 23 | 64 | 4 |
 Nashville Nashville |
26 | 24 | 59 | 7 |
 Chicago Chicago |
22 | 26 | 53 | 9 |
 Winnipeg Winnipeg |
22 | 26 | 52 | 8 |
 St. Louis St. Louis |
20 | 28 | 49 | 9 |

