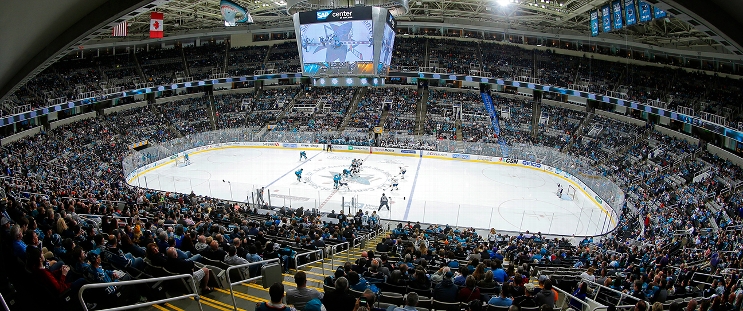
Ottawa Senators at San Jose Sharks
· National Hockey LeagueGaudette scores go-ahead goal as Senators beat Sharks 4-3 with only 11 shots on goal

Gaudette tipped a hard pass by Stutzle past Sharks goaltender Mackenzie Blackwood with 4:12 left for his fourth goal in as many games. San Jose had tied the game earlier in the period on goals by Macklin Celebrini and Will Smith.
Stutzle's assist was his third of the game.
Ottawa scored twice on its first three shots to lead 2-0 after one period. Stutzle had assists on both, scored by Gaudette at even strength and Josh Norris on the power play.
Mario Ferraro also scored for San Jose. Tyler Kleven recorded his first NHL goal for the Senators.
The Senators have won consecutive games after losing five straight, while the Sharks have lost four of five.
Sharks’ leading scorer Mikael Granlund missed his second straight game (upper body).
Sharks: The Sharks outshot the Senators 39-11, but Ullmark, who improved to 6-0 in his career against San Jose, was solid in net after losing his last four starts.
OTT leads series 1-0
Scoring Summary
 |
Goal | 1st Period 4:35 | Adam Gaudette Goal (10) Deflected, assists: Tim Stützle (17), Brady Tkachuk (13) |
 |
Goal | 1st Period 13:56 | Josh Norris Goal (9) Snap Shot, assists: Drake Batherson (14), Tim Stützle (18) |
 |
Goal | 2nd Period 9:19 | Mario Ferraro Goal (1) Wrist Shot, assists: Will Smith (5), Klim Kostin (1) |
 |
Goal | 2nd Period 15:22 | Tyler Kleven Goal (1) Slap Shot, assists: Claude Giroux (11) |
 |
Goal | 3rd Period 4:48 | Macklin Celebrini Goal (7) Wrist Shot, assists: William Eklund (16), Jake Walman (13) |
 |
Goal | 3rd Period 12:32 | Will Smith Goal (3) Tip-In, assists: Fabian Zetterlund (8), Timothy Liljegren (1) |
 |
Goal | 3rd Period 15:48 | Adam Gaudette Goal (11) Tip-In, assists: Tim Stützle (19), Brady Tkachuk (14) |
Statistics
 OTT OTT |
 SJ SJ |
|
|---|---|---|
| 24 | Blocked Shots | 6 |
| 30 | Hits | 29 |
| 5 | Takeaways | 5 |
| 11 | Shots | 39 |
| 1 | Power Play Goals | 1 |
| 2 | Power Play Opportunities | 2 |
| 50.0 | Power Play Percentage | 50.0 |
| 0 | Short Handed Goals | 0 |
| 0 | Shootout Goals | 0 |
| 27 | Faceoffs Won | 22 |
| 55.1 | Faceoff Win Percent | 44.9 |
| 13 | Giveaways | 19 |
| 2 | Total Penalties | 2 |
| 4 | Penalty Minutes | 4 |
Game Information
 SAP Center at San Jose
Location: San Jose, CA
Attendance: 10,778 | Capacity:

Location: San Jose, CA
Attendance: 10,778 | Capacity:
2024-25 Atlantic Division Standings
| TEAM | W | L | PTS | OTL |
|---|---|---|---|---|
 Toronto Toronto |
27 | 13 | 56 | 2 |
 Florida Florida |
24 | 15 | 50 | 2 |
 Boston Boston |
20 | 18 | 45 | 5 |
 Tampa Bay Tampa Bay |
21 | 15 | 44 | 2 |
 Ottawa Ottawa |
19 | 17 | 41 | 3 |
 Montreal Montreal |
19 | 18 | 41 | 3 |
 Detroit Detroit |
18 | 18 | 40 | 4 |
 Buffalo Buffalo |
15 | 21 | 35 | 5 |
2024-25 Pacific Division Standings
| TEAM | W | L | PTS | OTL |
|---|---|---|---|---|
 Vegas Vegas |
28 | 9 | 59 | 3 |
 Edmonton Edmonton |
25 | 12 | 53 | 3 |
 Los Angeles Los Angeles |
23 | 10 | 51 | 5 |
 Vancouver Vancouver |
18 | 12 | 45 | 9 |
 Calgary Calgary |
19 | 14 | 45 | 7 |
 Anaheim Anaheim |
17 | 18 | 39 | 5 |
 Seattle Seattle |
17 | 21 | 37 | 3 |
 San Jose San Jose |
13 | 24 | 32 | 6 |

