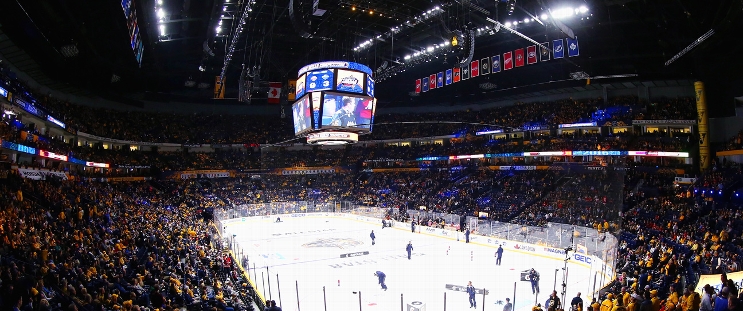
Philadelphia Flyers at Nashville Predators
· National Hockey LeagueCouturier scores in OT to give Flyers 3-2 win over Predators

Scott Laughton and Morgan Frost also scored and Aleksei Kolosov made 25 saves for the Flyers, who have won two of three.
Roman Josi and Ryan O’Reilly scored and Juuse Saros made 21 saves for the Predators, who have lost three of four.
Kolosov improved to 2-4-0 on the season.
With the Predators leading 2-1 late in the third, Frost tied it with 11.4 seconds remaining on a redirection to send the game to overtime.
Predators: The Predators were just seconds away from winning their third straight home game. The team struggled from the start of the season, including losing their first four at home. Gaining traction on home ice will be pivotal in Nashville attempting to get into the playoff race.
PHI leads series 1-0
Scoring Summary
 |
Goal | 1st Period 6:17 | Roman Josi Goal (5) Wrist Shot, assists: Alexandre Carrier (5) |
 |
Goal | 1st Period 12:46 | Scott Laughton Goal (3) Wrist Shot, assists: Ryan Poehling (7) |
 |
Goal | 1st Period 16:18 | Ryan O'Reilly Goal (4) Slap Shot, assists: Gustav Nyquist (4), Brady Skjei (7) |
 |
Goal | 3rd Period 19:48 | Morgan Frost Goal (3) Tip-In, assists: Travis Sanheim (9), Sean Couturier (7) |
 |
Goal | 4th Period 2:31 | Sean Couturier Goal (6) Tip-In, assists: Travis Konecny (16), Rasmus Ristolainen (5) |
Statistics
 PHI PHI |
 NSH NSH |
|
|---|---|---|
| 32 | Blocked Shots | 11 |
| 25 | Hits | 23 |
| 5 | Takeaways | 4 |
| 23 | Shots | 27 |
| 0 | Power Play Goals | 0 |
| 1 | Power Play Opportunities | 1 |
| 0.0 | Power Play Percentage | 0.0 |
| 0 | Short Handed Goals | 0 |
| 0 | Shootout Goals | 0 |
| 19 | Faceoffs Won | 28 |
| 40.4 | Faceoff Win Percent | 59.6 |
| 37 | Giveaways | 29 |
| 3 | Total Penalties | 3 |
| 6 | Penalty Minutes | 6 |
Game Information
 Bridgestone Arena
Location: Nashville, TN
Attendance: 17,159 | Capacity:

Location: Nashville, TN
Attendance: 17,159 | Capacity:
2024-25 Metropolitan Division Standings
| TEAM | W | L | PTS | OTL |
|---|---|---|---|---|
 Washington Washington |
26 | 10 | 56 | 4 |
 New Jersey New Jersey |
25 | 15 | 53 | 3 |
 Carolina Carolina |
24 | 15 | 50 | 2 |
 Columbus Columbus |
18 | 17 | 42 | 6 |
 Pittsburgh Pittsburgh |
17 | 17 | 42 | 8 |
 Philadelphia Philadelphia |
17 | 19 | 39 | 5 |
 NY Rangers NY Rangers |
18 | 20 | 38 | 2 |
 NY Islanders NY Islanders |
15 | 18 | 37 | 7 |
2024-25 Central Division Standings
| TEAM | W | L | PTS | OTL |
|---|---|---|---|---|
 Winnipeg Winnipeg |
28 | 12 | 58 | 2 |
 Minnesota Minnesota |
26 | 11 | 56 | 4 |
 Dallas Dallas |
25 | 13 | 51 | 1 |
 Colorado Colorado |
25 | 15 | 51 | 1 |
 St. Louis St. Louis |
19 | 19 | 42 | 4 |
 Utah Utah |
17 | 15 | 41 | 7 |
 Nashville Nashville |
13 | 21 | 33 | 7 |
 Chicago Chicago |
13 | 25 | 28 | 2 |

