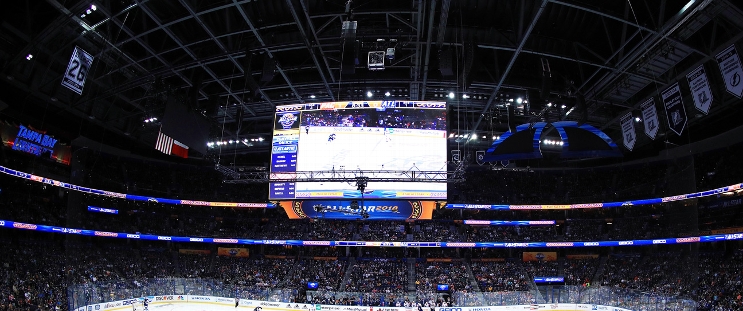
Washington Capitals at Tampa Bay Lightning
· National Hockey LeagueTom Wilson's power-play goal lifts the Capitals over the Lightning 5-4

With Anthony Cirelli in the box for a high-sticking, double-minor penalty with 4:03 left, Wilson tipped a Jakob Chychrun shot for the winning goal.
Aliaksei Protas scored shorthanded while Andrew Mangiapane, Dylan Strome and John Carlson scored for Washington, which has won six straight on the road. Charlie Lindgren finished with 24 saves.
Brayden Point registered his fifth career hat trick for Tampa Bay while Michael Eyssimont also scored for the Lightning. Andrei Vasilevskiy stopped 27 shots.
Tampa Bay had leads of 2-0, 3-2 and 4-3, with Point’s hat trick goal giving Tampa Bay the lead after Lindgren tried to play the puck behind him but fired it into his own net at 7:25 of the third period. But Carlson pulled the Capitals even again with 9:30 left.
Lightning: Head coach Jon Cooper coached his 900th career regular season game to become just the eighth coach in league history to do so with one franchise.
Series tied 1-1
Scoring Summary
 |
Goal | 1st Period 3:58 | Brayden Point Goal (13) Backhand, assists: Jake Guentzel (12) |
 |
Goal | 1st Period 12:27 | Brayden Point Goal (14) Snap Shot, assists: Nikita Kucherov (21), Victor Hedman (15) |
 |
Goal | 2nd Period 10:31 | Andrew Mangiapane Goal (5) Wrist Shot, assists: Lars Eller (5), Hendrix Lapierre (5) |
 |
Goal | 2nd Period 12:29 | Aliaksei Protas Goal (8) Wrist Shot, assists: Tom Wilson (10) |
 |
Goal | 2nd Period 19:16 | Michael Eyssimont Goal (2) Backhand, assists: Zemgus Girgensons (2) |
 |
Goal | 3rd Period 1:37 | Dylan Strome Goal (7) Wrist Shot, assists: Taylor Raddysh (6), Aliaksei Protas (12) |
 |
Goal | 3rd Period 7:25 | Brayden Point Goal (15) , assists: none |
 |
Goal | 3rd Period 10:30 | John Carlson Goal (3) Wrist Shot, assists: none |
 |
Goal | 3rd Period 16:34 | Tom Wilson Goal (7) Deflected, assists: Jakob Chychrun (6), Dylan Strome (24) |
Statistics
 WSH WSH |
 TB TB |
|
|---|---|---|
| 15 | Blocked Shots | 11 |
| 24 | Hits | 26 |
| 5 | Takeaways | 5 |
| 32 | Shots | 28 |
| 1 | Power Play Goals | 1 |
| 3 | Power Play Opportunities | 3 |
| 33.3 | Power Play Percentage | 33.3 |
| 1 | Short Handed Goals | 0 |
| 0 | Shootout Goals | 0 |
| 37 | Faceoffs Won | 21 |
| 63.8 | Faceoff Win Percent | 36.2 |
| 17 | Giveaways | 13 |
| 4 | Total Penalties | 3 |
| 11 | Penalty Minutes | 11 |
Game Information
 Amalie Arena
Location: Tampa, FL
Attendance: 19,092 | Capacity:

Location: Tampa, FL
Attendance: 19,092 | Capacity:
2024-25 Metropolitan Division Standings
| TEAM | W | L | PTS | OTL |
|---|---|---|---|---|
 Washington Washington |
34 | 11 | 74 | 6 |
 Carolina Carolina |
32 | 16 | 68 | 4 |
 New Jersey New Jersey |
29 | 18 | 64 | 6 |
 Columbus Columbus |
25 | 19 | 57 | 7 |
 NY Islanders NY Islanders |
23 | 20 | 53 | 7 |
 NY Rangers NY Rangers |
24 | 22 | 52 | 4 |
 Philadelphia Philadelphia |
23 | 24 | 52 | 6 |
 Pittsburgh Pittsburgh |
21 | 24 | 50 | 8 |
2024-25 Atlantic Division Standings
| TEAM | W | L | PTS | OTL |
|---|---|---|---|---|
 Florida Florida |
30 | 19 | 63 | 3 |
 Toronto Toronto |
30 | 19 | 62 | 2 |
 Ottawa Ottawa |
27 | 20 | 58 | 4 |
 Tampa Bay Tampa Bay |
27 | 20 | 57 | 3 |
 Boston Boston |
25 | 22 | 56 | 6 |
 Detroit Detroit |
25 | 21 | 55 | 5 |
 Montreal Montreal |
24 | 22 | 53 | 5 |
 Buffalo Buffalo |
19 | 26 | 43 | 5 |

