Los Angeles Kings at San Jose Sharks
· National Hockey LeagueCelebrini scores 2 and adds an assist as Sharks shock Kings 7-2

Celebrini’s goals highlighted a three-goal outburst early in the third period.
The No. 1 overall pick in last year’s draft scored at 1:03 of the third to snap a 2-2 deadlock. Timothy Liljegren scored just over a minute later and Celebrini scored on a five-on-three power play to break the game open.
Anze Kopitar and Brandt Clarke scored for Los Angeles.
Yaroslav Askarov had 22 saves in his first career home start for San Jose, and Kings goalie David Rittich stopped 14 shots.
Nico Sturm scored on a breakaway at 1:47 of the first period off an outlet pass from Mario Ferraro. Askarov was also credited with an assist.
Los Angeles was coming off a 2-1 win over Seattle but the Kings have had a hard time building any momentum. They’ve yet to put together a three-game winning streak this season.
SJ leads series 2-1
Scoring Summary
 |
Goal | 1st Period 1:47 | Nico Sturm Goal (4) Wrist Shot, assists: Mario Ferraro (4), Yaroslav Askarov (1) |
 |
Goal | 2nd Period 2:32 | Brandt Clarke Goal (3) Snap Shot, assists: Adrian Kempe (10), Anze Kopitar (19) |
 |
Goal | 2nd Period 8:58 | Anze Kopitar Goal (6) Backhand, assists: Adrian Kempe (11), Warren Foegele (5) |
 |
Goal | 2nd Period 13:59 | Fabian Zetterlund Goal (9) Wrist Shot, assists: William Eklund (14), Macklin Celebrini (4) |
 |
Goal | 3rd Period 1:03 | Macklin Celebrini Goal (5) Snap Shot, assists: Henry Thrun (7), Jan Rutta (2) |
 |
Goal | 3rd Period 2:14 | Timothy Liljegren Goal (2) Slap Shot, assists: Will Smith (3) |
 |
Goal | 3rd Period 3:43 | Macklin Celebrini Goal (6) Slap Shot, assists: William Eklund (15), Will Smith (4) |
 |
Goal | 3rd Period 10:46 | Alexander Wennberg Goal (6) Tip-In, assists: Jake Walman (12) |
 |
Goal | 3rd Period 18:39 | Luke Kunin Goal (5) Wrist Shot, assists: none |
Statistics
 LA LA |
 SJ SJ |
|
|---|---|---|
| 6 | Blocked Shots | 16 |
| 18 | Hits | 20 |
| 4 | Takeaways | 6 |
| 24 | Shots | 21 |
| 0 | Power Play Goals | 2 |
| 2 | Power Play Opportunities | 6 |
| 0.0 | Power Play Percentage | 33.3 |
| 0 | Short Handed Goals | 0 |
| 0 | Shootout Goals | 0 |
| 33 | Faceoffs Won | 27 |
| 55.0 | Faceoff Win Percent | 45.0 |
| 20 | Giveaways | 16 |
| 5 | Total Penalties | 2 |
| 12 | Penalty Minutes | 4 |
Game Information
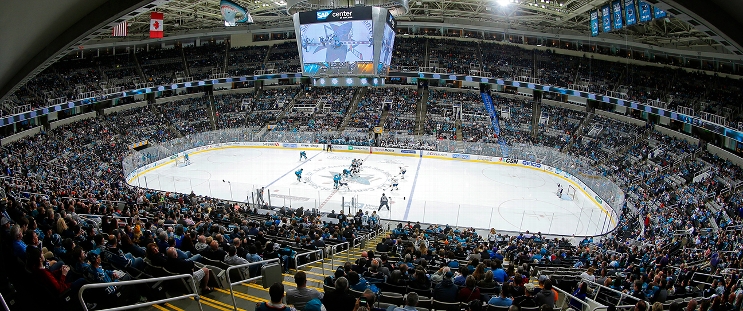
 SAP Center at San Jose
Location: San Jose, CA
Attendance: 10,713 | Capacity:

Location: San Jose, CA
Attendance: 10,713 | Capacity:
2024-25 Pacific Division Standings
| TEAM | W | L | PTS | OTL |
|---|---|---|---|---|
 Vegas Vegas |
28 | 9 | 59 | 3 |
 Edmonton Edmonton |
25 | 12 | 53 | 3 |
 Los Angeles Los Angeles |
23 | 10 | 51 | 5 |
 Vancouver Vancouver |
18 | 12 | 46 | 10 |
 Calgary Calgary |
19 | 14 | 45 | 7 |
 Anaheim Anaheim |
17 | 18 | 39 | 5 |
 Seattle Seattle |
17 | 21 | 37 | 3 |
 San Jose San Jose |
13 | 24 | 32 | 6 |

