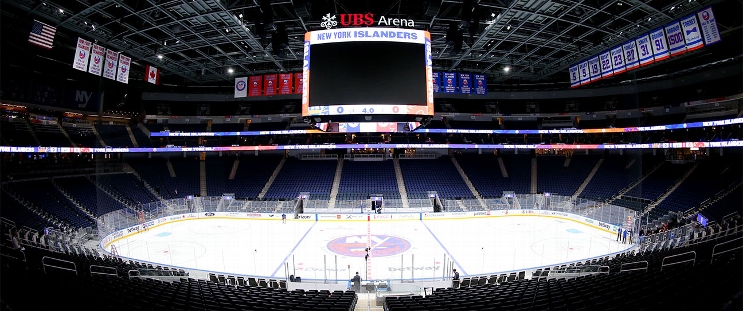
St. Louis Blues at New York Islanders
· National Hockey LeaguePalmieri, Nelson lead Islanders to 3-1 win over Blues to end three-game skid

Ilya Sorokin stopped 24 shots and got his 100th career victory for the Islanders.
Jake Neighbours scored for St. Louis and Jordan Binnington made 28 saves in the Blues' third loss in four games.
Nelson extended the Islanders lead to 2-0 with a power-play goal with 4:05 left in the second period. He buried a one-timer from his knees when Max Tsyplakov set him up in the slot.
Palmieri opened the scoring with 1:09 left in the first period.
Neighbours scored a power-play goal 45 seconds into the third to pull the Blues within a goal, but Palmieri sealed the Islanders' win with an empty-netter in the final minute.
Islanders: New York held a third-period lead in each of their last four games but managed only a 1-2-1 record, with their lone regulation win coming against the Blues on Saturday. ... Nelson moved ahead of Bob Bourne into a tie for ninth place with John Tonelli on the Islanders' scoring list with 544 points.
Series tied 1-1
Scoring Summary
 |
Goal | 1st Period 18:51 | Kyle Palmieri Goal (8) Wrist Shot, assists: Brock Nelson (4) |
 |
Goal | 2nd Period 15:55 | Brock Nelson Goal (8) Snap Shot, assists: Maxim Tsyplakov (9), Simon Holmstrom (7) |
 |
Goal | 3rd Period 0:45 | Jake Neighbours Goal (7) Snap Shot, assists: Pavel Buchnevich (8), Robert Thomas (8) |
 |
Goal | 3rd Period 19:23 | Kyle Palmieri Goal (9) Wrist Shot, assists: Brock Nelson (5) |
Statistics
 STL STL |
 NYI NYI |
|
|---|---|---|
| 6 | Blocked Shots | 20 |
| 24 | Hits | 29 |
| 4 | Takeaways | 2 |
| 25 | Shots | 31 |
| 1 | Power Play Goals | 1 |
| 1 | Power Play Opportunities | 2 |
| 100.0 | Power Play Percentage | 50.0 |
| 0 | Short Handed Goals | 0 |
| 0 | Shootout Goals | 0 |
| 19 | Faceoffs Won | 34 |
| 35.8 | Faceoff Win Percent | 64.2 |
| 12 | Giveaways | 14 |
| 2 | Total Penalties | 1 |
| 4 | Penalty Minutes | 2 |
Game Information
 UBS Arena
Location: Elmont, NY
Attendance: 17,255 | Capacity:

Location: Elmont, NY
Attendance: 17,255 | Capacity:
2024-25 Central Division Standings
| TEAM | W | L | PTS | OTL |
|---|---|---|---|---|
 Winnipeg Winnipeg |
28 | 12 | 58 | 2 |
 Minnesota Minnesota |
26 | 11 | 56 | 4 |
 Dallas Dallas |
25 | 13 | 51 | 1 |
 Colorado Colorado |
25 | 15 | 51 | 1 |
 St. Louis St. Louis |
19 | 19 | 42 | 4 |
 Utah Utah |
17 | 15 | 41 | 7 |
 Nashville Nashville |
13 | 21 | 33 | 7 |
 Chicago Chicago |
13 | 25 | 28 | 2 |
2024-25 Metropolitan Division Standings
| TEAM | W | L | PTS | OTL |
|---|---|---|---|---|
 Washington Washington |
26 | 10 | 56 | 4 |
 New Jersey New Jersey |
25 | 15 | 53 | 3 |
 Carolina Carolina |
24 | 15 | 50 | 2 |
 Columbus Columbus |
18 | 17 | 42 | 6 |
 Pittsburgh Pittsburgh |
17 | 17 | 42 | 8 |
 Philadelphia Philadelphia |
17 | 19 | 39 | 5 |
 NY Rangers NY Rangers |
18 | 20 | 38 | 2 |
 NY Islanders NY Islanders |
15 | 18 | 37 | 7 |

