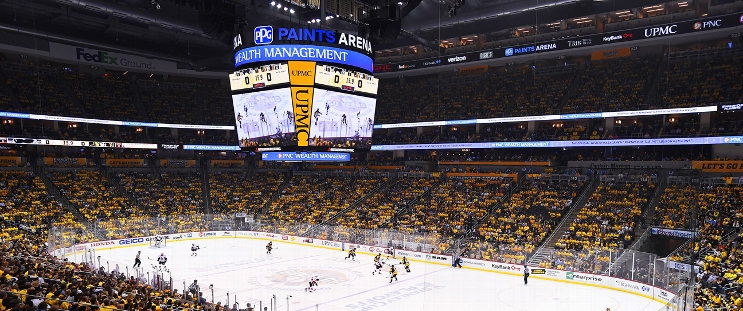
Winnipeg Jets at Pittsburgh Penguins
· National Hockey LeagueConnor has goal and assist as Jets beat Penguins 4-1

Connor became the third player in Jets history to record at least 25 points through 20 games in a season. Gabriel Vilardi scored a power-play goal, while Nino Niederreiter and Vladislav Namestnikov also scored for the Jets, who built a 3-0 lead through two periods.
Winnipeg equaled the second-most wins (17) by any franchise through the first 20 games of a season. The Jets are 10-0 when scoring first.
Connor Hellebuyck, who stopped 17 shots, has a league-best 14 wins in 16 games. The reigning Vezina Trophy winner also ranks among the NHL leaders in goals-against average and save percentage.
Michael Bunting scored a power-play goal in the third period for Pittsburgh. Tristan Jarry made 26 saves.
Penguins: Lost for the fifth time in six games. Pittsburgh has dropped 13 of its last 17 overall.
WPG wins series 2-0
Scoring Summary
 |
Goal | 1st Period 1:22 | Nino Niederreiter Goal (8) Backhand, assists: none |
 |
Goal | 2nd Period 4:53 | Vladislav Namestnikov Goal (6) Backhand, assists: Nikolaj Ehlers (14) |
 |
Goal | 2nd Period 19:01 | Gabriel Vilardi Goal (8) Wrist Shot, assists: Kyle Connor (13), Josh Morrissey (18) |
 |
Goal | 3rd Period 5:49 | Michael Bunting Goal (4) Wrist Shot, assists: Bryan Rust (3), Evgeni Malkin (15) |
 |
Goal | 3rd Period 18:49 | Kyle Connor Goal (13) Wrist Shot, assists: Cole Perfetti (10), Mark Scheifele (13) |
Statistics
 WPG WPG |
 PIT PIT |
|
|---|---|---|
| 14 | Blocked Shots | 14 |
| 11 | Hits | 29 |
| 5 | Takeaways | 6 |
| 30 | Shots | 18 |
| 1 | Power Play Goals | 1 |
| 3 | Power Play Opportunities | 3 |
| 33.3 | Power Play Percentage | 33.3 |
| 0 | Short Handed Goals | 0 |
| 0 | Shootout Goals | 0 |
| 32 | Faceoffs Won | 31 |
| 50.8 | Faceoff Win Percent | 49.2 |
| 18 | Giveaways | 14 |
| 4 | Total Penalties | 4 |
| 11 | Penalty Minutes | 11 |
Game Information
 PPG Paints Arena
Location: Pittsburgh, PA
Attendance: 15,232 | Capacity:

Location: Pittsburgh, PA
Attendance: 15,232 | Capacity:
2024-25 Central Division Standings
| TEAM | W | L | PTS | OTL |
|---|---|---|---|---|
 Winnipeg Winnipeg |
27 | 12 | 56 | 2 |
 Minnesota Minnesota |
25 | 11 | 54 | 4 |
 Colorado Colorado |
25 | 15 | 51 | 1 |
 Dallas Dallas |
24 | 13 | 49 | 1 |
 St. Louis St. Louis |
19 | 18 | 42 | 4 |
 Utah Utah |
17 | 15 | 41 | 7 |
 Nashville Nashville |
13 | 20 | 33 | 7 |
 Chicago Chicago |
13 | 25 | 28 | 2 |
2024-25 Metropolitan Division Standings
| TEAM | W | L | PTS | OTL |
|---|---|---|---|---|
 Washington Washington |
26 | 10 | 56 | 4 |
 New Jersey New Jersey |
25 | 15 | 53 | 3 |
 Carolina Carolina |
24 | 14 | 50 | 2 |
 Pittsburgh Pittsburgh |
17 | 17 | 41 | 7 |
 Columbus Columbus |
17 | 17 | 40 | 6 |
 Philadelphia Philadelphia |
17 | 18 | 39 | 5 |
 NY Rangers NY Rangers |
18 | 20 | 37 | 1 |
 NY Islanders NY Islanders |
15 | 18 | 37 | 7 |

