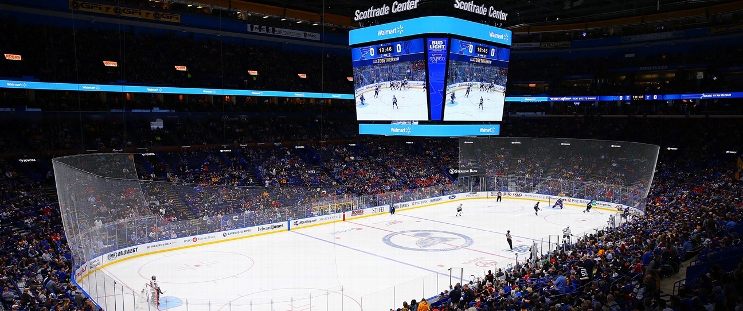
San Jose Sharks at St. Louis Blues
· National Hockey LeagueJake Neighbours' shootout goal gives Blues 3-2 win over Sharks

Binnington bounced back after allowing Alexander Wennberg’s tying goal with 8.8 seconds left to notch his 151st career victory and tie Mike Liut’s franchise record.
Wennberg had both goals for the Sharks. Mikael Granlund and Macklin Celebrini, the No. 1 pick in the 2024 NHL draft, assisted both goals.
Jordan Kyrou and Nathan Walker scored in regulation for the Blues, who won for just the second time in their last nine games. Walker scored 11 seconds into the game after Radek Faksa intercepted a pass from Sharks goaltender Yaroslav Askarov.
Kyrou, sandwiched between Granlund and Timothy Liljegren at the top of the crease, jammed home a pass from Pierre-Olivier Joseph for his sixth goal of the season with 8:13 left in the second.
Binnington had 22 saves in the win, while Askarov had 29 saves.
Blues: Binnington ranks second among goalies in franchise history with 295 games played. He reached the 151-win mark in 56 fewer games than Liut, who went 151-133 with 52 ties from 1979-1985.
STL leads series 2-0
Scoring Summary
 |
Goal | 1st Period 0:11 | Nathan Walker Goal (3) Wrist Shot, assists: Radek Faksa (3) |
 |
Goal | 1st Period 8:23 | Alexander Wennberg Goal (4) Wrist Shot, assists: Mikael Granlund (14), Macklin Celebrini (2) |
 |
Goal | 2nd Period 11:47 | Jordan Kyrou Goal (6) Tip-In, assists: Pierre-Olivier Joseph (2), Robert Thomas (7) |
 |
Goal | 3rd Period 19:51 | Alexander Wennberg Goal (5) Wrist Shot, assists: Mikael Granlund (15), Macklin Celebrini (3) |
 |
Goal | 5 0:00 | Jake Neighbours Goal Wrist Shot |
Statistics
 SJ SJ |
 STL STL |
|
|---|---|---|
| 16 | Blocked Shots | 20 |
| 23 | Hits | 22 |
| 3 | Takeaways | 6 |
| 24 | Shots | 31 |
| 1 | Power Play Goals | 0 |
| 2 | Power Play Opportunities | 1 |
| 50.0 | Power Play Percentage | 0.0 |
| 0 | Short Handed Goals | 0 |
| 0 | Shootout Goals | 0 |
| 28 | Faceoffs Won | 29 |
| 49.1 | Faceoff Win Percent | 50.9 |
| 22 | Giveaways | 16 |
| 1 | Total Penalties | 2 |
| 2 | Penalty Minutes | 4 |
Game Information
 Enterprise Center
Location: Saint Louis, MO
Attendance: 17,273 | Capacity:

Location: Saint Louis, MO
Attendance: 17,273 | Capacity:
2024-25 Pacific Division Standings
| TEAM | W | L | PTS | OTL |
|---|---|---|---|---|
 Vegas Vegas |
28 | 9 | 59 | 3 |
 Edmonton Edmonton |
25 | 12 | 53 | 3 |
 Los Angeles Los Angeles |
23 | 10 | 51 | 5 |
 Vancouver Vancouver |
18 | 12 | 45 | 9 |
 Calgary Calgary |
19 | 14 | 45 | 7 |
 Anaheim Anaheim |
17 | 18 | 39 | 5 |
 Seattle Seattle |
17 | 21 | 37 | 3 |
 San Jose San Jose |
13 | 24 | 32 | 6 |
2024-25 Central Division Standings
| TEAM | W | L | PTS | OTL |
|---|---|---|---|---|
 Winnipeg Winnipeg |
28 | 12 | 58 | 2 |
 Minnesota Minnesota |
26 | 11 | 56 | 4 |
 Dallas Dallas |
25 | 13 | 51 | 1 |
 Colorado Colorado |
25 | 15 | 51 | 1 |
 St. Louis St. Louis |
19 | 19 | 42 | 4 |
 Utah Utah |
17 | 15 | 41 | 7 |
 Nashville Nashville |
13 | 21 | 33 | 7 |
 Chicago Chicago |
13 | 25 | 28 | 2 |

