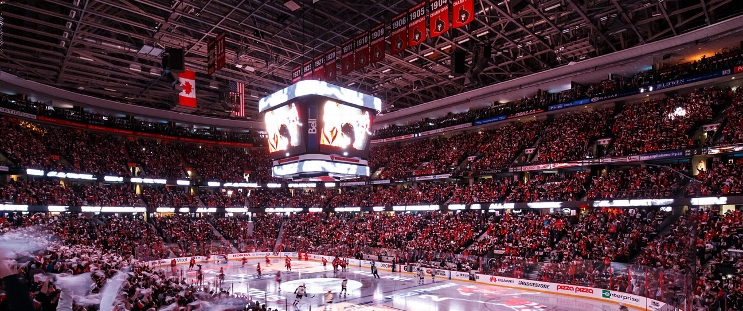
Vegas Golden Knights at Ottawa Senators
· National Hockey LeagueSamsonov makes 38 saves as Golden Knights beat Senators 3-2

Samsonov had given up 10 goals in his previous two outings but made key saves on Josh Norris, David Perron, Tim Stutzle and Brady Tkachuk to keep the Senators at bay.
The Senators (8-10-1) are now mired in a four-game losing streak and have only managed two goals in their last three games.
Vegas (12-6-2) took the lead early in the first period when Linus Ullmark made a diving save but was unable to get back into position, giving Jack Eichel an open net for his sixth goal of the season. Brett Howden made it 2-0 midway through the second with a goal that beat Ullmark, who made 29 saves, under the arm.
Adam Gaudette finally beat Samsonov 7:17 into the third with two seconds remaining on the power play to cut the lead in half, but Pavel Dorofeyev regained the two-goal lead exactly two minutes later.
Drake Batherson kept the Senators within reach and scored on a Jake Sanderson rebound with just over seven minutes remaining. They were unable to complete the comeback despite outshooting Vegas 18-5 in the third.
Golden Knights: Vegas capitalized off a poor Ottawa line change and got a free pass up the ice that led to Howden’s goal and a 2-0 lead.
VGK wins series 2-0
Scoring Summary
 |
Goal | 1st Period 6:45 | Jack Eichel Goal (6) Wrist Shot, assists: Ivan Barbashev (10), Shea Theodore (13) |
 |
Goal | 2nd Period 10:51 | Brett Howden Goal (8) Wrist Shot, assists: Ivan Barbashev (11), Noah Hanifin (6) |
 |
Goal | 3rd Period 7:17 | Adam Gaudette Goal (8) Snap Shot, assists: Ridly Greig (3), Claude Giroux (8) |
 |
Goal | 3rd Period 9:17 | Pavel Dorofeyev Goal (10) Wrist Shot, assists: William Karlsson (6), Alexander Holtz (7) |
 |
Goal | 3rd Period 12:38 | Drake Batherson Goal (8) Wrist Shot, assists: Jake Sanderson (10), Tim Stützle (15) |
Statistics
 VGK VGK |
 OTT OTT |
|
|---|---|---|
| 23 | Blocked Shots | 11 |
| 30 | Hits | 36 |
| 3 | Takeaways | 4 |
| 32 | Shots | 40 |
| 0 | Power Play Goals | 1 |
| 2 | Power Play Opportunities | 3 |
| 0.0 | Power Play Percentage | 33.3 |
| 0 | Short Handed Goals | 0 |
| 0 | Shootout Goals | 0 |
| 27 | Faceoffs Won | 35 |
| 43.5 | Faceoff Win Percent | 56.5 |
| 8 | Giveaways | 20 |
| 4 | Total Penalties | 3 |
| 8 | Penalty Minutes | 6 |
Game Information
 Canadian Tire Centre
Location: Ottawa, ON
Attendance: 16,822 | Capacity:

Location: Ottawa, ON
Attendance: 16,822 | Capacity:
2024-25 Pacific Division Standings
| TEAM | W | L | PTS | OTL |
|---|---|---|---|---|
 Vegas Vegas |
28 | 9 | 59 | 3 |
 Edmonton Edmonton |
25 | 12 | 53 | 3 |
 Los Angeles Los Angeles |
23 | 10 | 51 | 5 |
 Vancouver Vancouver |
18 | 12 | 45 | 9 |
 Calgary Calgary |
19 | 14 | 45 | 7 |
 Anaheim Anaheim |
17 | 18 | 39 | 5 |
 Seattle Seattle |
17 | 21 | 37 | 3 |
 San Jose San Jose |
13 | 24 | 32 | 6 |
2024-25 Atlantic Division Standings
| TEAM | W | L | PTS | OTL |
|---|---|---|---|---|
 Toronto Toronto |
27 | 13 | 56 | 2 |
 Florida Florida |
24 | 15 | 50 | 2 |
 Boston Boston |
20 | 18 | 45 | 5 |
 Tampa Bay Tampa Bay |
21 | 15 | 44 | 2 |
 Ottawa Ottawa |
19 | 17 | 41 | 3 |
 Montreal Montreal |
19 | 18 | 41 | 3 |
 Detroit Detroit |
18 | 18 | 40 | 4 |
 Buffalo Buffalo |
15 | 21 | 35 | 5 |

